
Figures & data
Table 1. Bivariate Pearson product-moment correlation coefficients between the obliquely rotated component scores (orthogonally rotated component scores in parentheses) of the CSI, gender, age, cycling distance, cycling frequency, and number of cycling accidents in the past 3 years.Table Footnotea
Figure 1. Correlation coefficients between the 2 CSI component scores and the 5 criterion variables for obliquely rotated components, orthogonally rotated components, and partial correlations between the 2 CSI component scores and the 5 criterion variables. Gender is coded as 1 = female, 2 = male. SM = safety motives score, MTS = motor–tactical skills score.
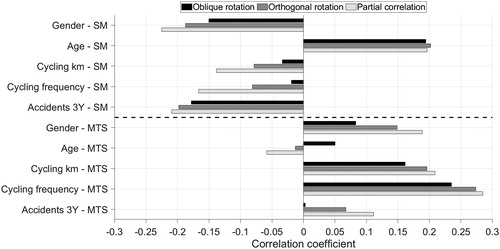
Figure 2. Mean safety motives score and mean motor–tactical skills score (based on orthogonally rotated components) for the 10 levels of self-reported weekly cycling kilometers during the summertime (r = −0.08 and r = 0.20, respectively). The sample sizes are indicated at the top of the figure. The inset shows the mean safety motives score and mean skills score for 5 levels of self-reported mileage (r = −0.31 and r = 0.50, respectively) from the DSI (Lajunen and Summala Citation1995). The dashed and dotted lines are least-squares fits of the reported means. The mean and standard deviation of the safety motives score and the motor–tactical skills score of the total sample of the present study are 0 and 1, respectively.
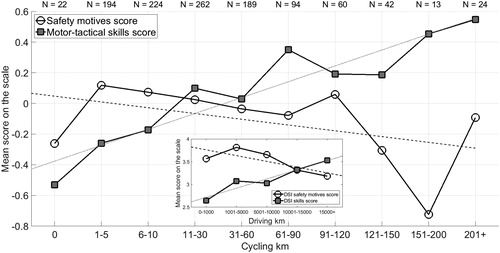
Figure 3. Mean safety motives score and mean motor–tactical skills score (based on orthogonally rotated components) for combinations of gender and cycling experience. Also shown are the mean numbers of self-reported cycling accidents in the past 3 years. The error bars indicate the mean ± standard error of the mean. The mean and standard deviation of the safety motives score and the motor–tactical skills score of the total sample are 0 and 1, respectively.
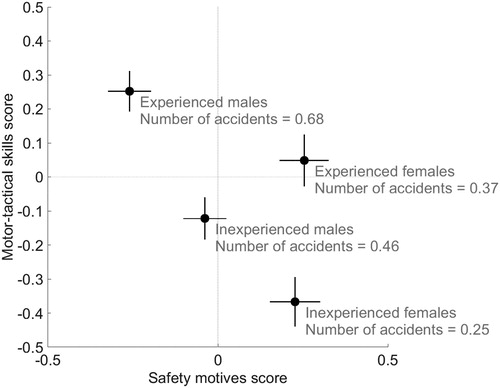
Figure 4. Mean safety motives score and mean skills score for combinations of gender and driving experience from Lajunen and Summala (Citation1995). The error bars indicate the mean ± standard error of the mean.
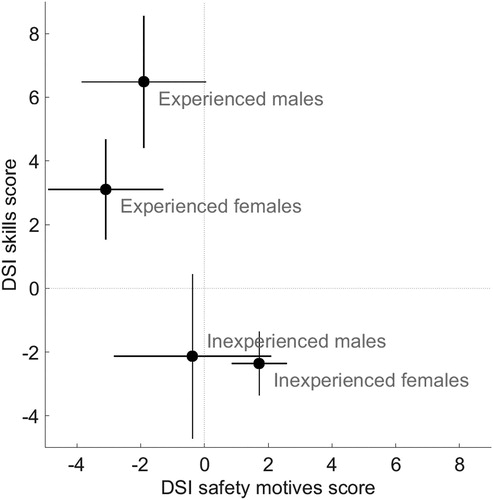
Table 2. Linear regression analysis for predicting the number of cycling accidents in the past 3 years.Table Footnotea
Supplemental Material
Download MS Word (197.2 KB)Data availability
Supplemental material for this article is available at https://doi.org/10.1080/15389588.2019.1639158, whereas raw data and scripts are available at https://doi.org/10.4121/uuid:daec0b0a-17fc-425b-988c-d55c4fae476a.