
Figures & data
Figure 1. All vehicle- and freight vehicle–related death and nonfatal injury rates per trillion vehicle miles traveled, United States, 2005–2015.
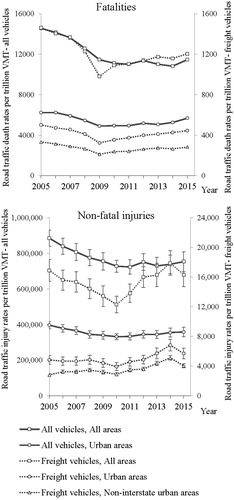
Table 1. Location of all vehicle- and freight vehicle–related fatalities injuries, United States, 2005–2015.a
Table 2. Location of all vehicle- and freight vehicle–related nonfatal injuries, United States, 2005–2015.a
Table 3. Person-level characteristics of fatal vehicle- and freight vehicle–related crashes by location type, United States, 2015.a
Table 4. Person-level characteristics of nonfatal vehicle- and freight vehicle–related crashes by location type, United States, 2015.a
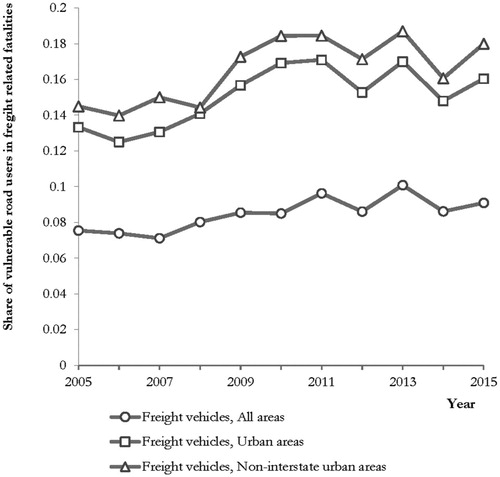
Figure 2. Share of vulnerable road users in freight vehicle–related fatalities, United States, 2005–2015.
Supplemental Material
Download MS Word (36.1 KB)Data availability statement
The data sets generated during and/or analyzed during the current study are available from the corresponding author on reasonable request.