
Figures & data
Table 1. Characteristics of the measurement sites included in the analyses.a
Figure 1. Average directional speed (km/h) of bicyclists passing the measurement sites. Based on weekdays (Monday to Friday). Direction 1 (dir. 1) is representing the direction towards the city center and direction 2 (dir. 2) is the opposite direction. The sites 16–19 have no information of directional average speeds. Blue bars = Stockholm, green bars = Linköping, orange bars = Eskilstuna.
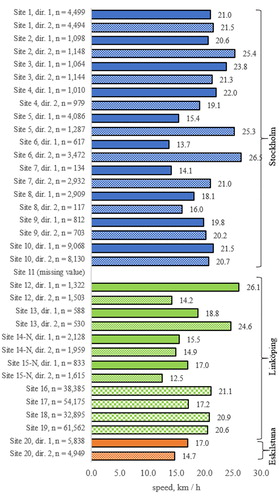
Table 2. Results of analysis of variance applied to speed data from site 20.Table Footnotea
Figure 2. Adjusted mean values of speed at site 20 for type of day and time of day, 2015. The error bars represent 95% CI. Results from analysis of variance.
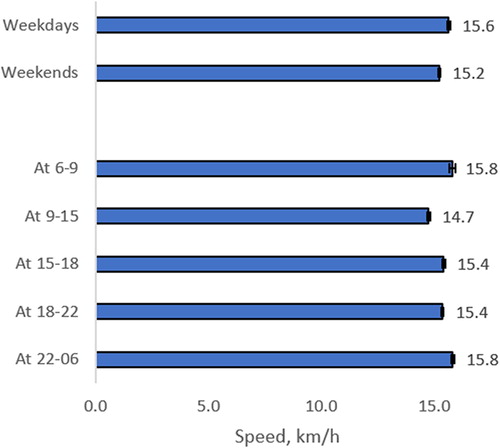
Figure 3. Speed distribution in box plot, divided by direction. Sorted by average speed. Based on weekdays (Monday to Friday). Box = 15th and 85th percentile, respectively. Line in box = The median speed. Cross in box = Average speed. Whiskers limitations = 5th and 95th percentile, respectively. Dots = Extreme values. Direction 1 (dir. 1) is representing the direction towards the city center and direction 2 (dir. 2) is the opposite direction.
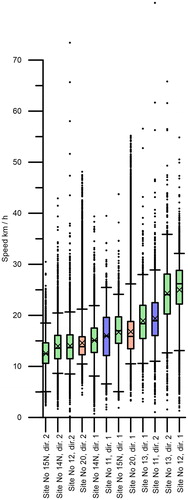
Table 3. Number of observed cyclists and distribution of bicycle type, sites 11–15.