Figures & data
Table 1. Maximum resultant of accelerations measured in the crash test dummy head when hitting the floor after sideway falls with four different types of bicycles.
Table 2. Maximum resultant of accelerations measured in the crash test dummy head when hitting the floor after simulated single-bicycle crashes in 15 or 25 km per hour with four different types of bicycles.
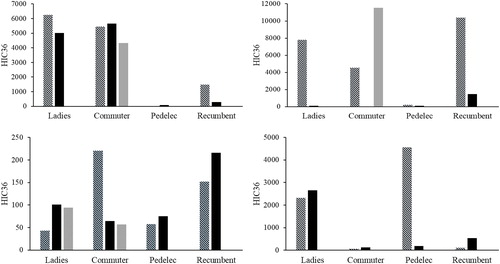
Figure 1. Calculated HIC36 values from the accelerations measured in the crash test dummy head when hitting the floor after simulated single-bicycle crashes with four different types of bicycles. At the top the sudden stop scenario in 15 followed by 25 km per hour. The two lower figures show the dislocated front wheel scenario in 15 and 25 km per hour respectively. Raw data filtered using a CFC 1000 filter.