
Figures & data
Figure 1. Study intersection (example; Source: Google maps, Street view).
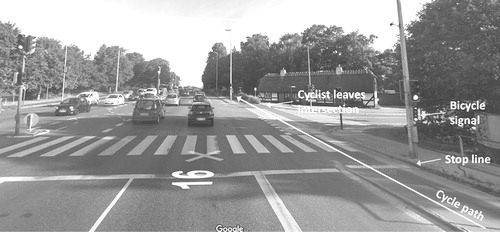
Figure 2. Speed measurement.
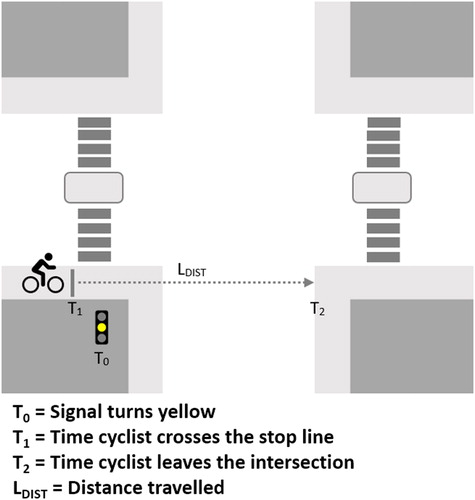
Table 1. Descriptive statistics for time after red and speed, helmeted vs. unhelmeted cyclists.
Figure 3. Mean time after yellow and speed by cyclist and intersection related variables.
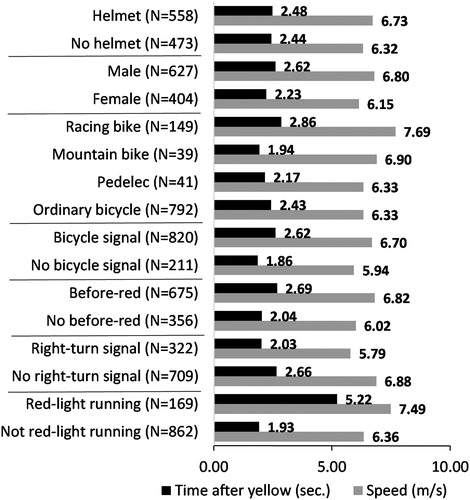
Table 2. Helmet use by bicycle type and gender.
Table 3. Linear regression models for time after yellow and speed; unstandardized coefficients for helmet use and model characteristics (N = 1031 for all models).
Supplemental material