Figures & data
Figure 1. Standard highway driving test. Left: Volunteers drive a specially instrumented vehicle for about 1 hr over a 100-km primary highway circuit, accompanied by a licensed driving instructor having access to dual controls. The volunteer's task is to drive with a steady lateral position between the delineated boundaries of the slower (right) traffic lane, while maintaining a constant speed of 95 km/hr. The lateral position of the car relative to the middle line, between the left and right traffic lane, is continuously measured by means of a camera that is mounted on the roof of the car. Right: schematic drawing of the highway-driving test. The standard deviation of lateral position (SDLP) is an index of road tracking error or “weaving”. Sleepiness, or drugs that induce sleepiness or sedation, causes loss of vehicle control, leading to increased road tracking error. Figure and description adapted from van der Sluiszen et al. (Citation2019).
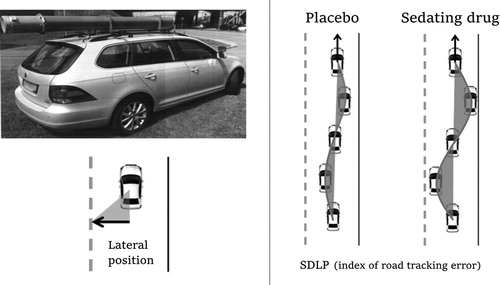
Table 1. Demographic data for patients and healthy controls. Mean (±SD) is reported, if applicable.
Figure 2. The mean (±SE) SDLP from the 1st to 4th segment (i.e. Time-on-Task effect) for both groups separately. Error bars are depicted 1-tailed for visualization purposes.
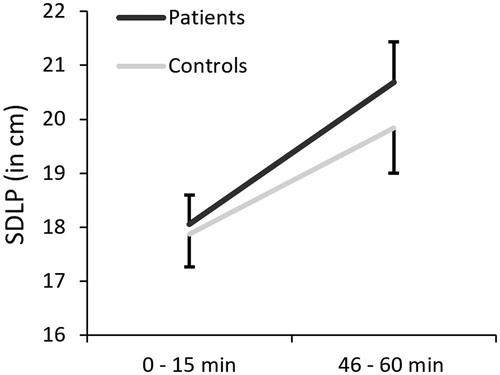
Figure 3. Mean (95%CI) difference from controls in SDLP (i.e. ΔSDLP) for patient subgroups based on diagnosis and treatment. The dotted line indicates the threshold for clinically relevant impairment. Abbreviations: NT1 = narcolepsy type 1 (n=32); STI = stimulants only (n=19); COM = combination of stimulants, sodium oxybate, antidepressants (n=16).
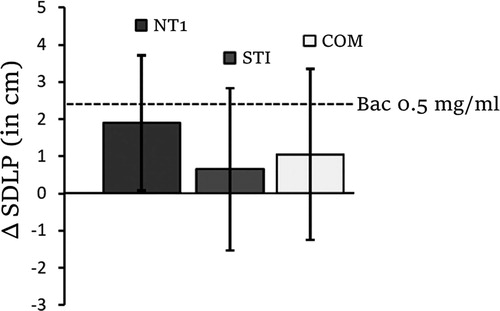
Figure 4. Individual SDLP values for healthy controls (grey circles) and each patient (sub)group (black circles). The median SDLP value for each group is shown in each box as a horizontal bar. The box lengths represents the 25th and 75th percentiles, whereas the whiskers represent the minimum and maximum values for each group. Terminated driving tests are shown as striped circles. Abbreviations: NT1 = narcolepsy type 1; STI = stimulants only; COM = combination of stimulants, sodium oxybate and/or antidepressants.
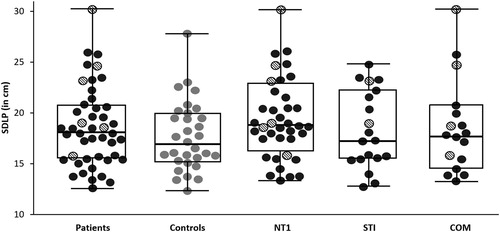
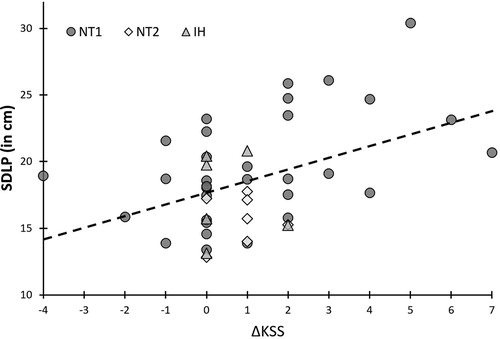
Figure 5. Correlation between individual driving performances (n = 45) as indicated by the standard deviation of lateral position (SDLP) and changes in subjective sleepiness during driving, as indicated by the delta Karolinska Sleepiness Scale (ΔKSS). Approximately 20% of the variance in SDLP across patient groups is explained by subjective sleepiness. Abbreviations: NT1 = Narcolepsy with cataplexy; NT2 = narcolepsy without cataplexy; IH = Idiopathic Hypersomnia.