
Figures & data
Figure 1. DTW speeding-exceedance profile medoids.
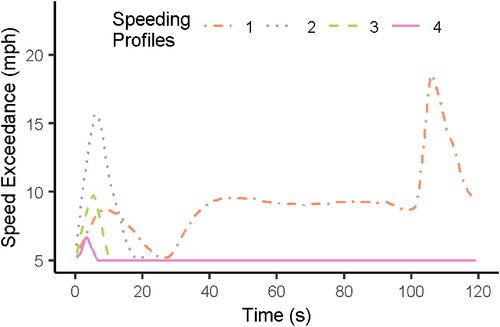
Table 1. Distribution of speeding parameters by speed-exceedance profile and for the overall data.
Table 2. Multivariable model estimates for dependent variables: duration, mean speeding magnitude, max speeding magnitude, and standard deviation of speeding.
Figure 2. Distribution of clusters across primary driving state (Manual, PA, ACC), duration, and mean speed magnitude.
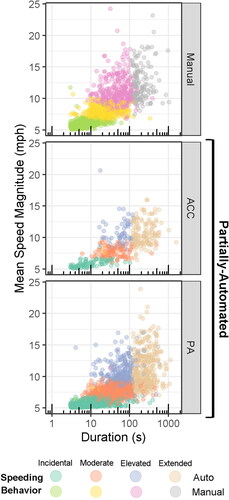
Table 3. Distribution of speeding parameters, speed limit, and automation use by cluster.
Data availability statement
Data are AVT proprietary and at this time of writing is not publicly available.