
Figures & data
Figure 1. An example of the cyclist tracks as processed from the Viscando system for location 1 (left) and location 2 (right).
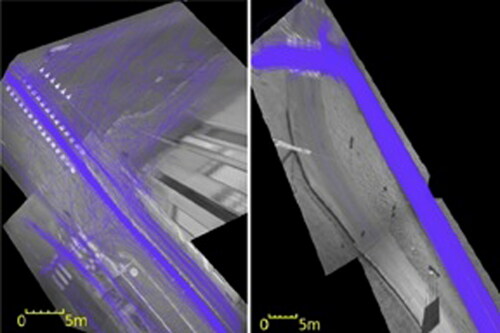
Figure 2. Distribution of cyclist speed at different positions and conditions for location 1 (top) and location 2 (bottom). The numbers on the top report the sample size for each boxplot.
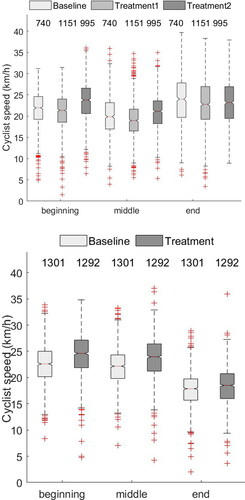
Table 1. Summary of ANOVA results for location 1 and location 2 for factors condition and position.
Table 2. Summary of ANOVA results for location 1 and location 2 for factors condition and wind (wind threshold = 1 km/h).
Supplemental material
Supplemental Material
Download MS Word (1.9 MB)Data availability statement
The data in this study are not publicly available.