
Figures & data
Figure 1. NADS high-fidelity motion-based simulator (left), AutoDrive display (right).
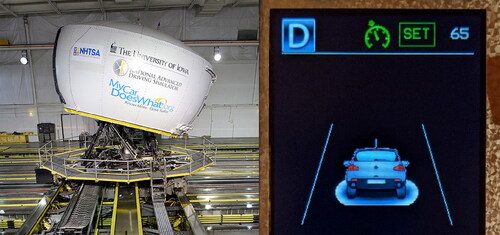
Figure 2. Gaze AOIs: front, rearview mirror, left window and mirror, phone task.
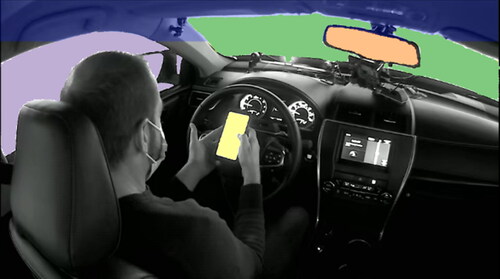
Figure 3. Scan path sequences for one event.
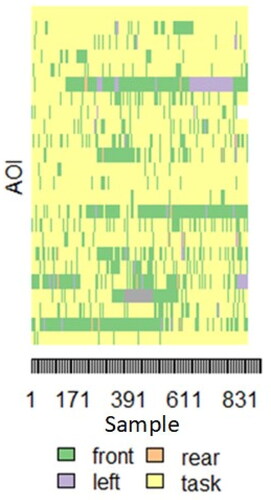
Figure 4. Four clusters in 30 second sequences describe driver behaviors. (a) disengaged, (b) mostly disengaged, (c) split evenly, (d) engaged.
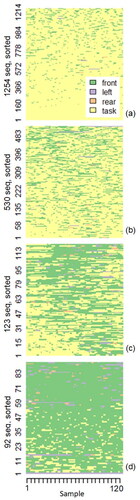
Figure 5. Hidden Markov Models for each cluster. Circles denote hidden states. State compositions show emission probabilities for each gaze AOI. (a) disengaged, (b) mostly disengaged, (c) split evenly, (d) engaged.
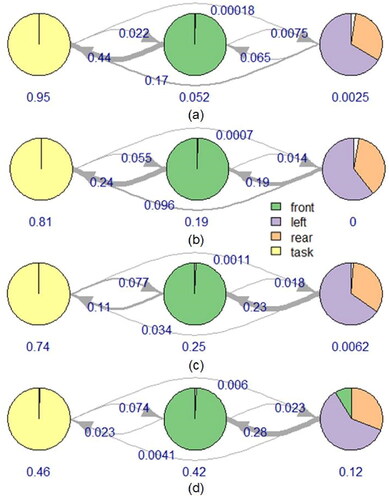
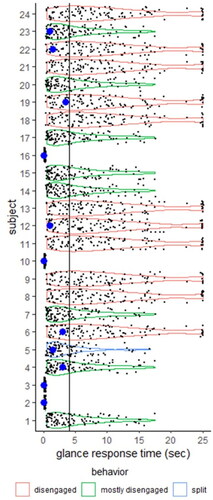
Figure 6. Simulated glance response times during the silent failure event. Large dots show actual glance response times. Driver behavior prior to the event is color coded.
Supplemental material