
Figures & data
Figure 1. Location of the study area in Japan.
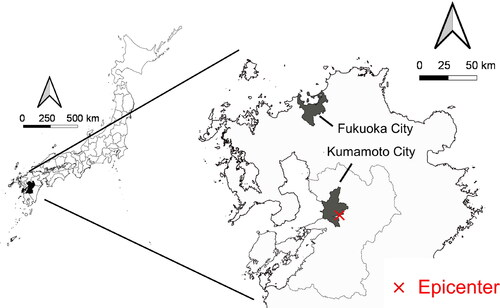
Figure 2. Impact model considered for general linear models.
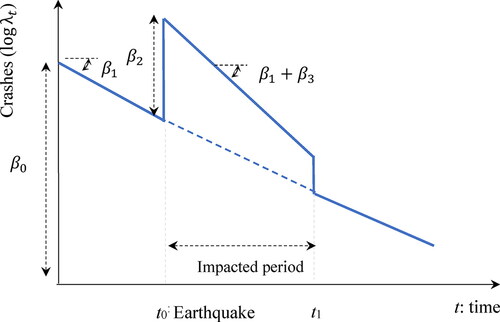
Table 1. Summary of possible models.
Figure 3. Annual changes in injury crashes in Kumamoto city, Japan.
Source: Kumamoto city statistical report (KC Citation2022).
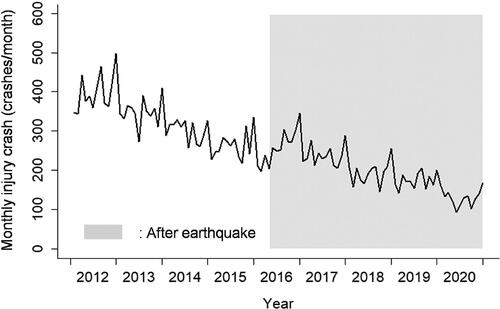
Figure 4. Annual changes in injury crashes in Fukuoka city, Japan.
Source: Fukuoka city statistical report (FC Citation2022).
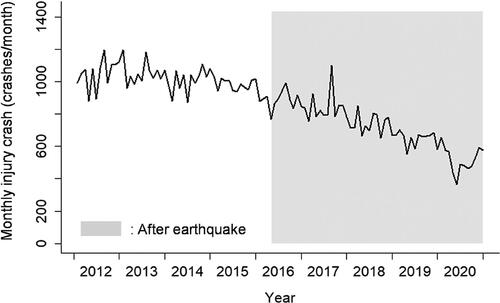
Table 2. Summary of estimated impact periods and injury-crash increase in Kumamoto city.
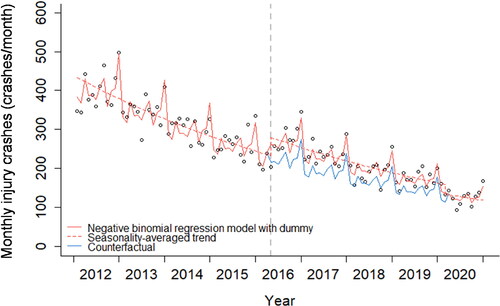
Figure 5. Modeled and counterfactual injury-crash trends for Kumamoto city.
Supplemental material
Supplemental Material
Download Zip (163.5 KB)Code availability
The codes that support the findings of this study are available from the corresponding author upon reasonable request.