
Figures & data
Figure 1. The sled test setup with reaction load cells for the KB condition with the HIII (top) and KBAB condition with the THOR (bottom).
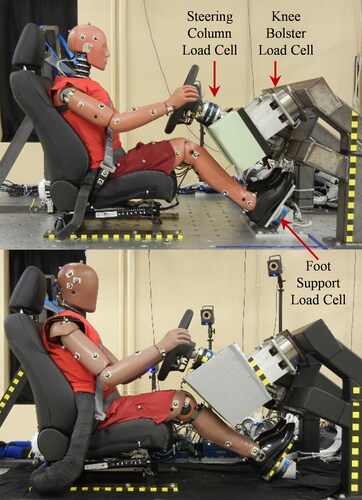
Table 1. Summary of average reaction force ISO results.
Figure 2. Steering column (top), right knee bolster (middle), and right foot support (bottom) forces for the KB condition. The knee bolster forces (middle) were truncated at the local minimum immediately preceding any upper extremity interaction.
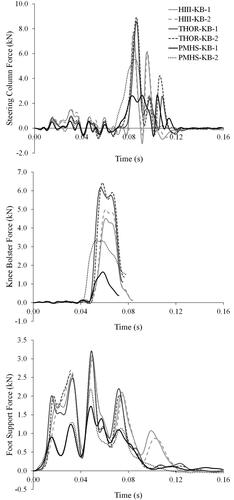
Table 2. Summary of average ISO results by location and internal/external.
Supplemental material