Figures & data
Table 1. LODC frontal test matrix, recline angle, BPB, belt tension, and number of tests conducted.
Figure 1. Time series of head rotational displacements of all conditions. Positive values represent rearward rotation while negative values represent forward rotation.
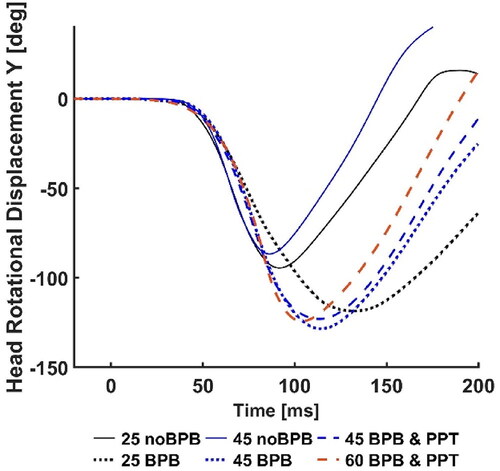
Figure 2. Mean and SD of Head Y angular rotation and displacement. Error bars represent standard deviations. Negative values represent forward rotation.
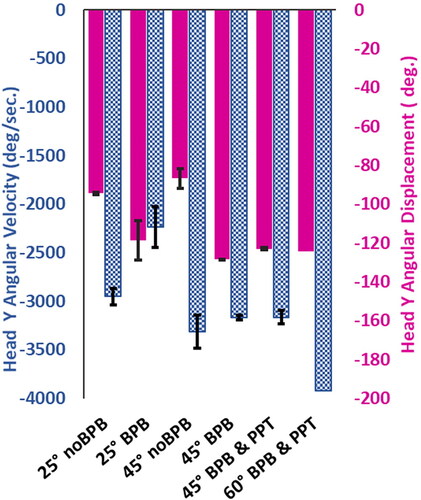
Figure 3. Mean and SD peak upper neck shear and tension forces. Error bars represent standard deviations and dashed bars represent IARVs (Mertz et al. Citation2003).
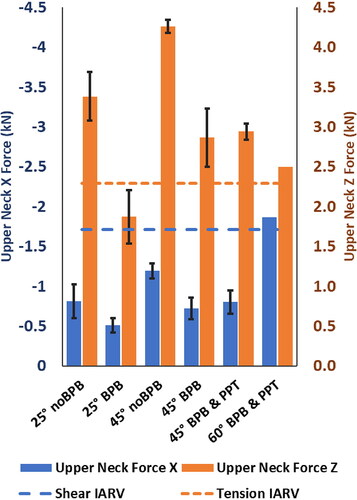
Figure 4. Mean and SD peak upper neck moments. Error bars represent standard deviations. Forward flexion is represented as positive and dashed bars represent IARVs (Mertz et al. Citation2003).
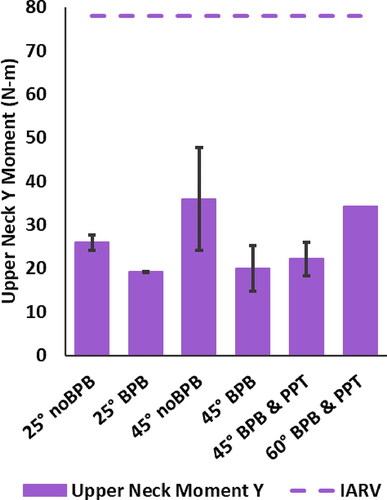
Figure 5. Mean and SD peak thoracic spine resultant accelerations. Error bars represent standard deviations and dashed bars represent IARV for T4 (Mertz et al. Citation2003).
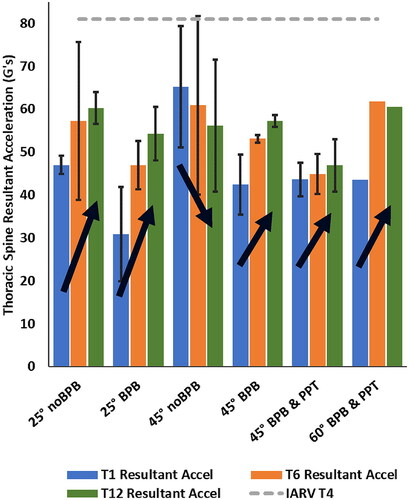
Figure 6. Mean and SD peak thoracic spine sagittal angular displacements. Error bars represent standard deviations. Negative values represent forward rotation.
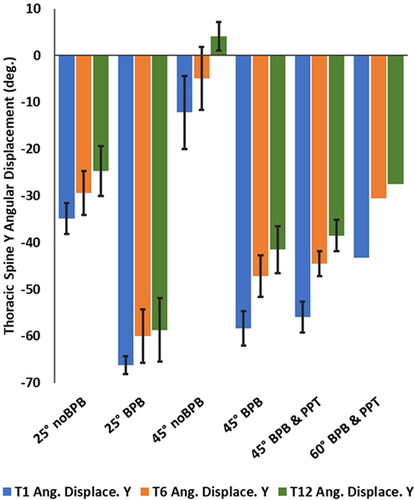
Figure 7. Time series of T1 rotational displacements of all conditions. Positive values represent rearward rotation while negative values represent forward rotation.
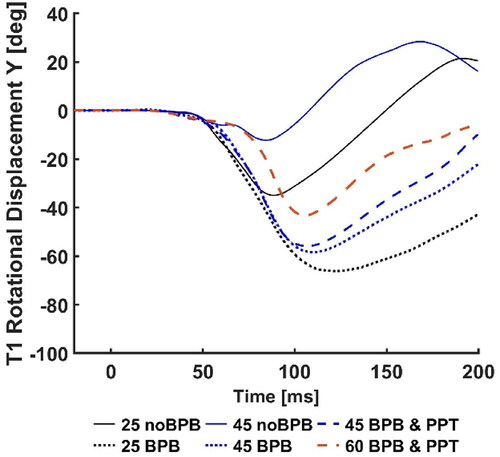
Figure 8. Time series of T6 rotational displacements of all conditions. Positive values represent rearward rotation while negative values represent forward rotation.
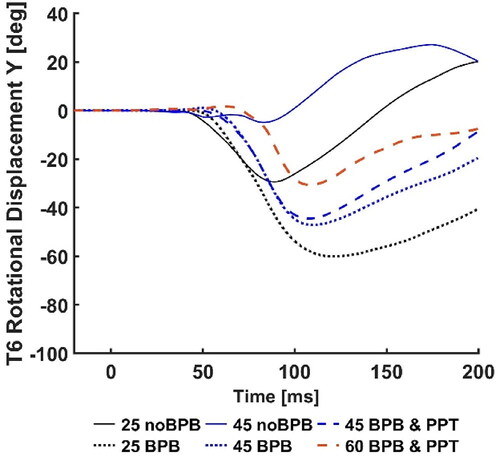
Figure 9. Time series of T12 rotational displacements of all conditions. Positive values represent rearward rotation while negative values represent forward rotation.
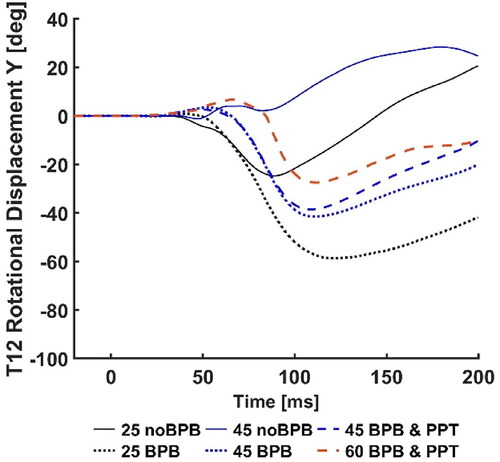
Figure 10. Mean and SD peak lumbar spine shear forces. Error bars represent standard deviations.
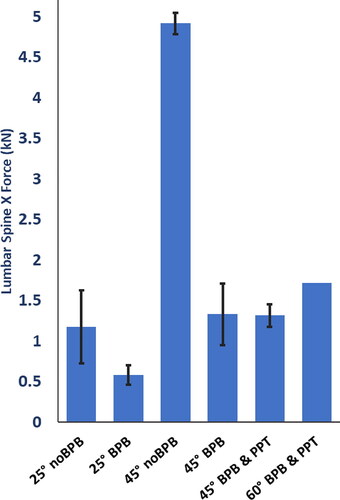
Figure 11. Mean and SD peak lumbar sagittal moments. Error bars represent standard deviations. Forward flexion is represented as positive.
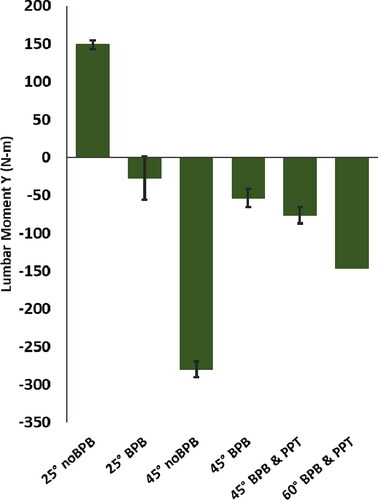
Figure A1. Mean sled acceleration pulse with FMVSS 213 upper and lower corridors.
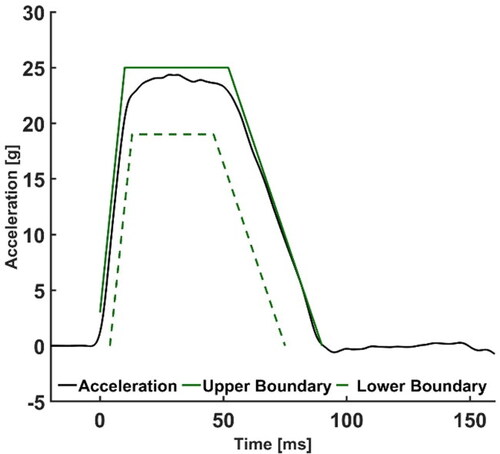
Figure A2. Mean and SD peak head resultant acceleration. Error bars represent standard deviations.
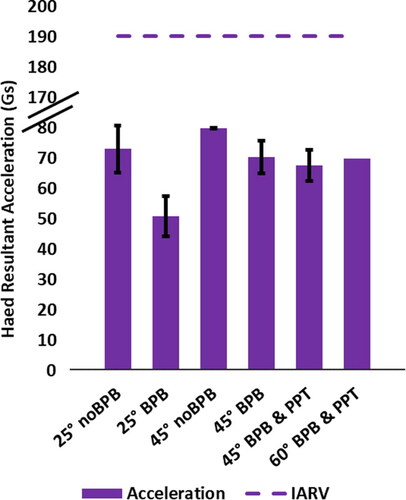
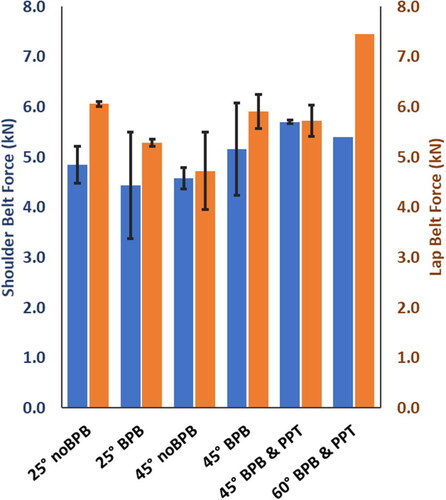
Figure A3. Mean and AD peak shoulder and lap belt forces. Error bars represent standard deviations.