Figures & data
Figure 1. (a) Proportions of steering wheel control levels across time. Automation disengagement is at 0 sec and marked with a dashed line. (b) Proportion of hands-free driving across time, with the trend-stationary hands-on-wheel behavior periods (lag, response, and recovery) marked with horizontal lines.
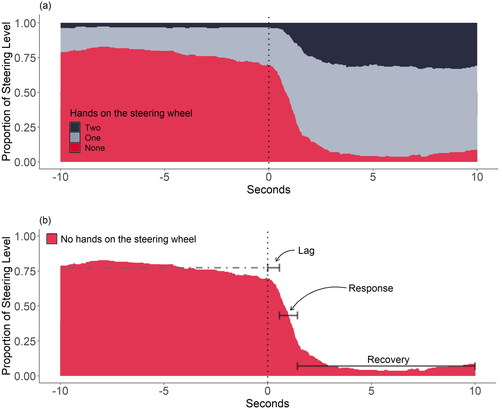
Figure 2. (a) Proportions of glances 10 sec before and 10 sec after automation-initiated disengagement across the different glance areas. Automation disengagement is at 0 sec and marked with a dashed line. (b) Proportion of glances to the road across time, with the trend-stationary glance behavior periods (lag, response, and recovery) marked with horizontal lines.
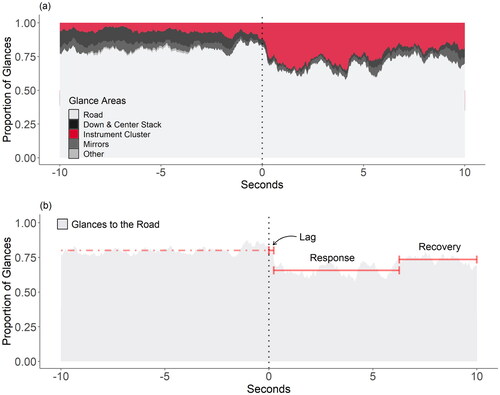
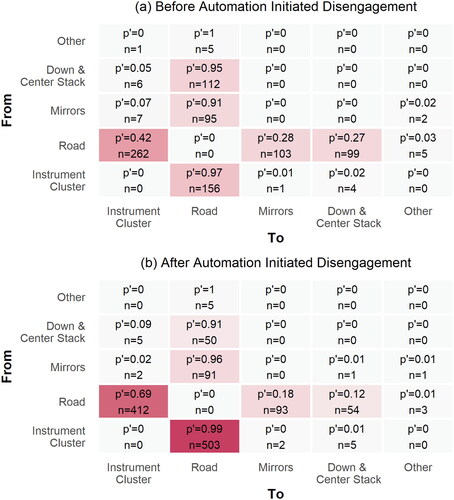
Figure 3. Transition matrices showing estimated transition probabilities (p’) and number of transitions (n) from (y-axis) and to (x-axis) glance areas, during the 10 sec before (a) and after (b) automation-initiated disengagement. Each cell in the transition matrix is color-coded and the color intensity correlates with the number of transitions.