Figures & data
Figure 1. Schematic showing lumbar spine specimen subjected to structural characterization experiments: 1) the 6-DOF serial robotic test device robotic test device, 2) external linear actuators, 3) follower load control load cells, 4) follower load cables, 5) specimen potting cups, 6) lumbar spine specimen, 7) robot control load cell, 8) mounting platform.
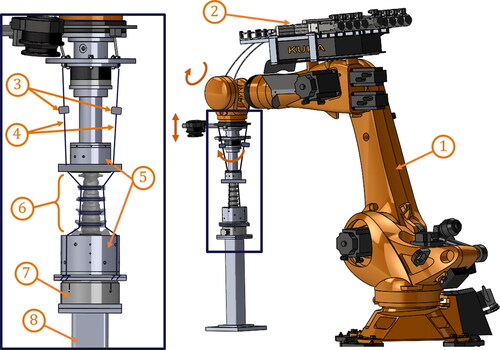
Figure 2. Left lateral (left) and anterior (right) views of an example lumbar spine specimen (sacrum side on the bottom), in the neutral position, mounted in the robotic test fixture, with the follower load cables passing through the spine collars at L1, L2, L3, and L4.
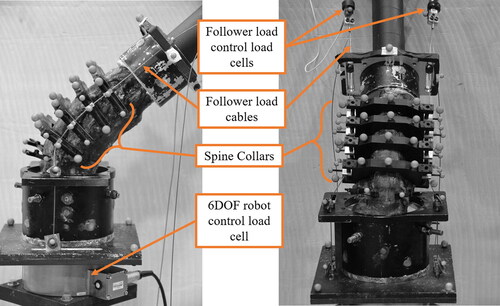
Figure 3. Flexion/extension response of each lumbar spine specimen with no axial compression. Flexion moments and extension angles are shown as positive, whereas extension moments and flexion angles are negative.
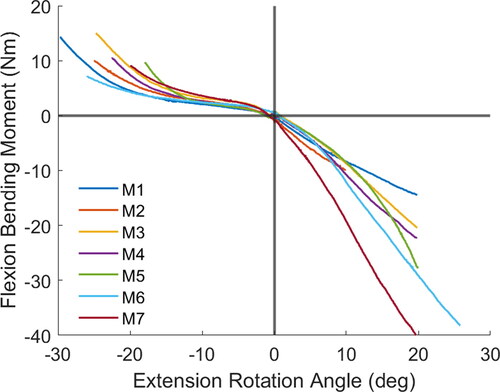
Figure 4. Intervertebral joint deformations (flexion/extension angle) as a percentage of whole spine deformation (bending angle) by level and axial compressive load. For instance, the sum of the 0 N bars in flexion is 100%.
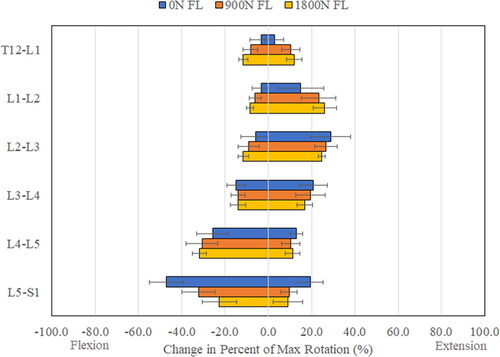
Figure 5. Moment-angle average responses (dashed lines) and upper and lower corridor bounds (solid lines) for each of the three levels of axial compressive load for the lumbar spine in flexion. Flexion moment and angle are shown positive and negative, respectively.
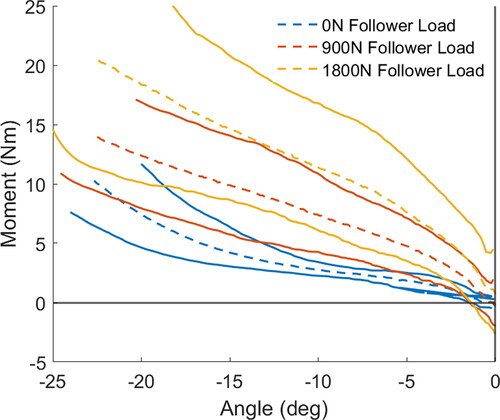
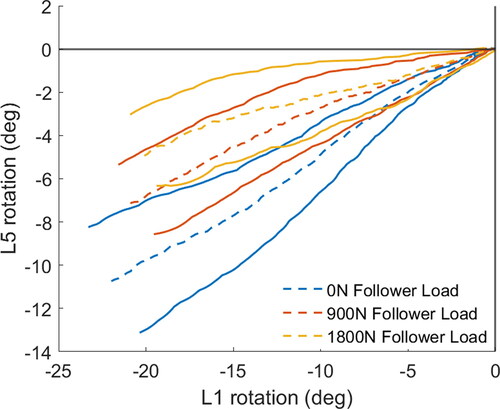
Figure 6. L5 rotation vs. L1 rotation average responses (dashed lines) and upper and lower corridor bounds (solid lines) for each of the three levels of axial compressive load for the lumbar spine in flexion. Flexion angles are shown negative.