Figures & data
Figure 1. Count of crashes by year and crash nature in Queensland from 2001 to 2021.
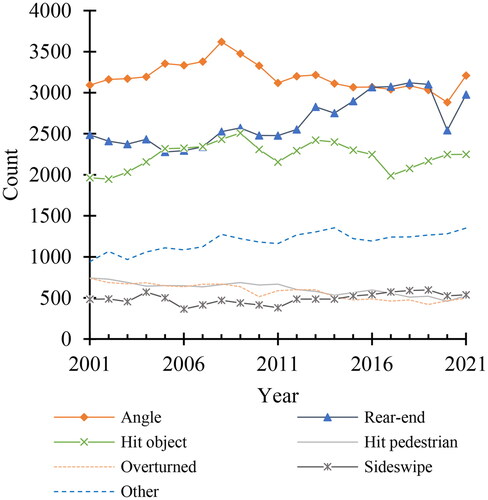
Table 1. Crashes by crash nature and severity of crash.
Figure 2. Results from tree model 1: Environmental characteristics associated with rear-end crashes vs. other crashes. Each node box shows (i) the most likely class (i.e., rear-end crash or other crash), (ii) the conditioned probability to be a crash other than a rear-end, (iii) the conditioned probability to be a rear-end crash, and (iv) the percentage of observations in that node.
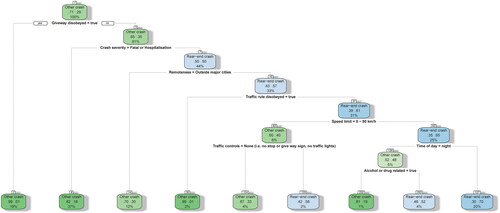
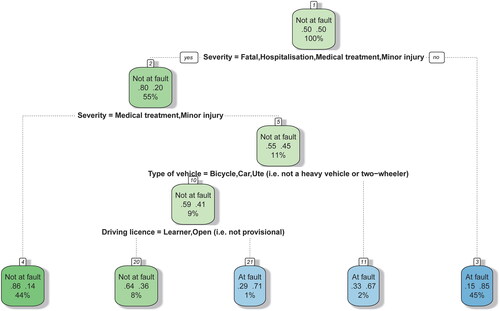
Figure 3. Results from tree model 2: Personal and vehicle characteristics associated with being at fault vs. not at fault in a rear-end crash. Each node box shows (i) the most likely class (i.e., at fault or not), (ii) the conditioned probability to be not at fault, (iii) the conditioned probability to be at fault, and (iv) the percentage of observations in that node.