
Figures & data
Table 1. Percent reduction in dummy responses by decade since the 1980 NCAP baseline.
Figure 1. Vehicle weight by decade for selected NCAP tests.
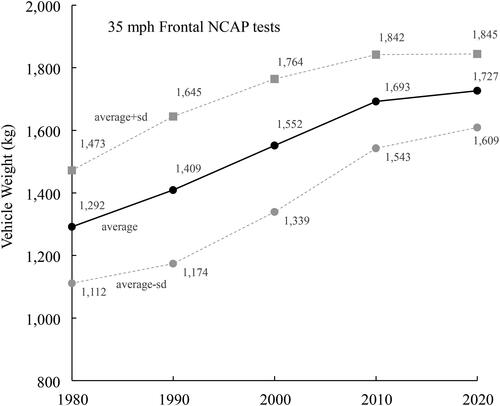
Figure 2. Front crush by decade for selected NCAP tests.
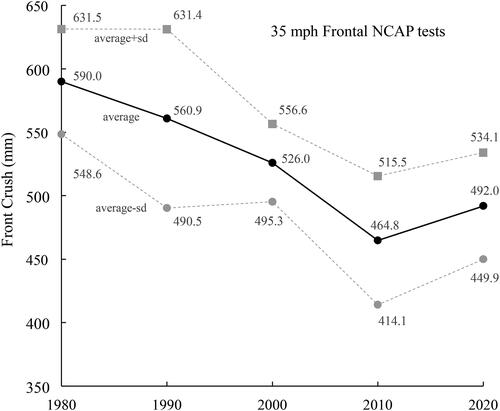
Figure 3. Vehicle dynamics in NCAP tests with eight generations of Nissan Maxima and the early Datsun 210.
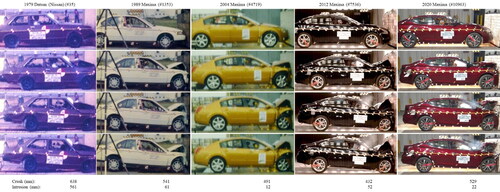
Figure 4. Intrusion of the firewall (plenum) by decade for selected NCAP tests.
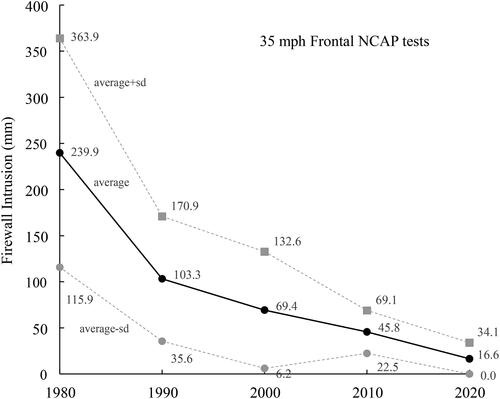
Table 2. 1994–2015 NASS field data for frontal crashes with belted use and adjustment to 1988–1991 NASS data from Kahane (Citation1994).
Figure 5. Driver HIC15 by decade for selected NCAP tests.
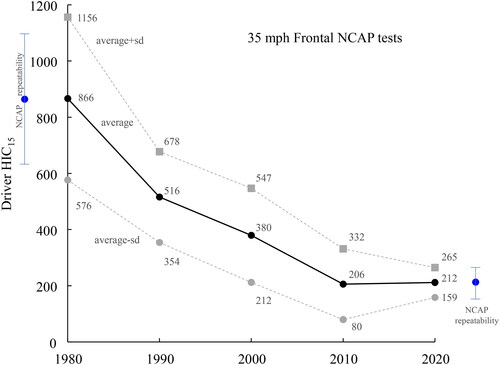
Figure 6. Driver chest acceleration by decade for selected NCAP tests.
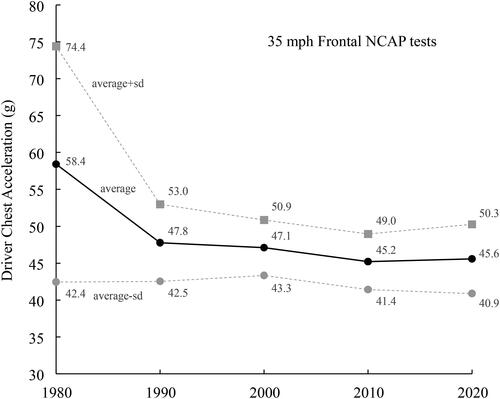
Figure 7. Driver head injury risk based on HIC15 by decade for selected NCAP tests.
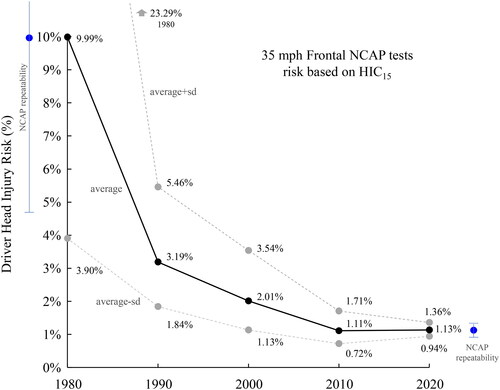
Figure 8. Driver chest injury risk based on chest acceleration by decade for selected NCAP tests.
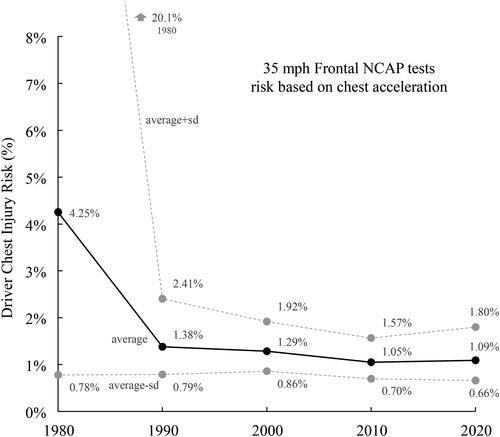
Figure 9. Passenger HIC15 by decade for selected NCAP tests.
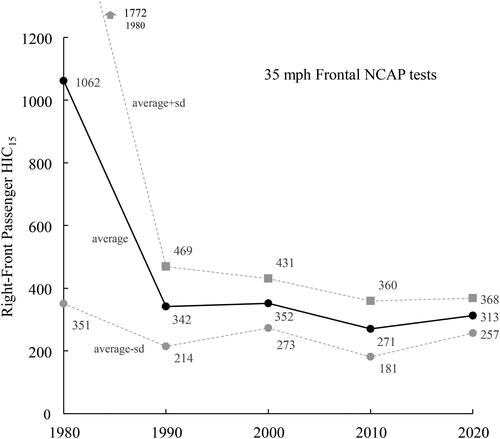
Figure 10. Passenger chest acceleration by decade for selected NCAP tests.
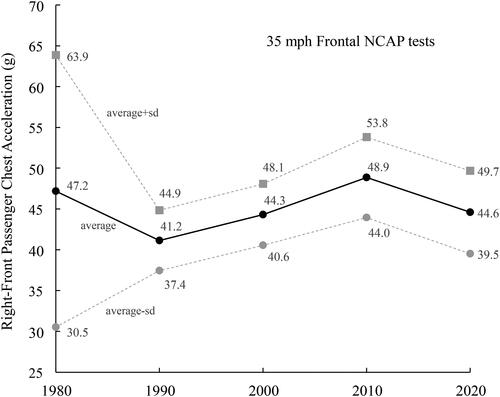
Figure 11. Passenger head injury risk based on HIC15 by decade for selected NCAP tests.
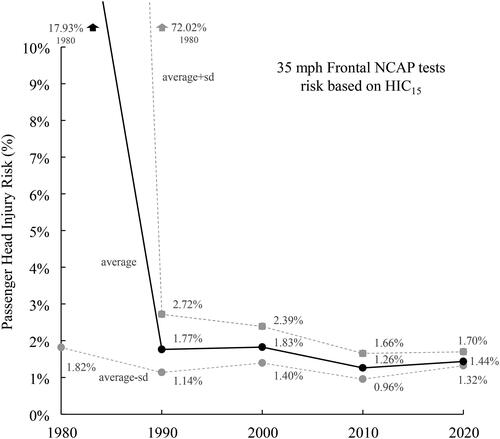
Figure 12. Passenger chest injury risk based on chest acceleration by decade for selected NCAP tests.
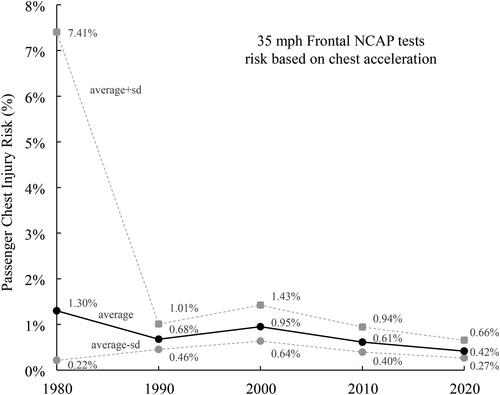
Figure 13. Risk for severe injury with belt use in frontal crashes by delta-V.
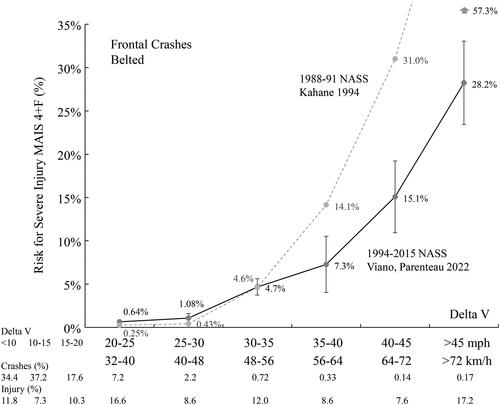
Figure 14. Frequency of frontal crash exposure and severe injury (MAIS 4 + F) with injury risk and se and equivalent HIC15.
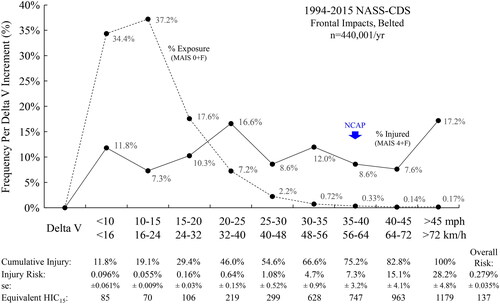
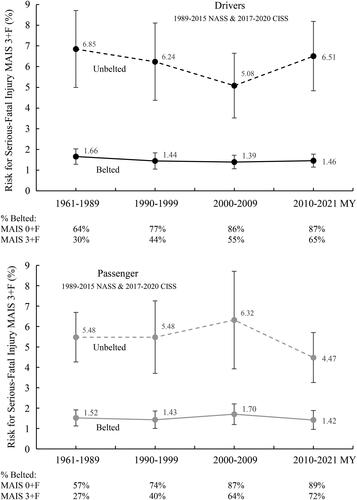
Figure 15. Risk for serious injury (MAIS 3 + F) in belted and unbelted drivers (top) and passengers (bottom) by vehicle MY.
Supplemental Material
Download Zip (117.6 KB)Data availability statement
The crash test movies, data and reports are available from the NHTSA website (https://www.nhtsa.gov/research-data/research-testing-databases#/) using the test number (#) as a guide. Additional information on the data analysis can be requested of the author at [email protected].