
Figures & data
Figure 1. Vehicle dynamics in 35, 40 and 48 mph (56.3, 64.4 and 77.3 km/h) frontal barrier impacts, tests #5, #1 and #4.
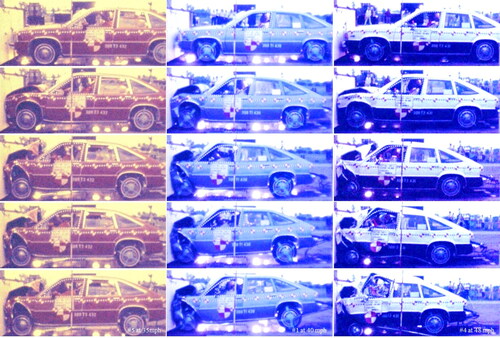
Table 1. Initial NCAP testing with the 1980 Chevrolet Citation.
Table 2. 35 mph NCAP Cash tests with restrained occupants.
Table 3. Occupant responses in the 35 mph NCAP Cash tests.
Figure 2. Head injury criterion (HIC) for lap-belted 6 yo dummy in rear seat of 35 mph NCAP crash tests.
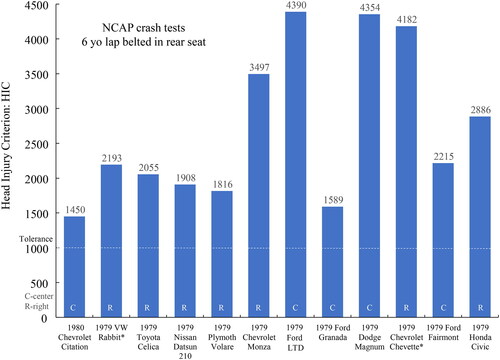
Figure 3. Child kinematics with lap belt in rear seat in 35 mph frontal NCAP tests #65, #73 and #92.

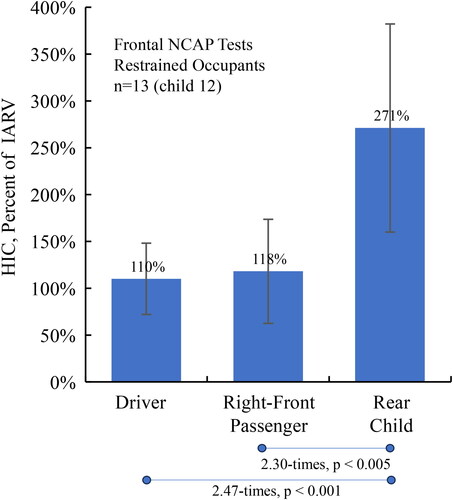
Figure 4. Percent of IARV for HIC in the driver, right-front passenger and rear 6 yo child in 35 mph NCAP tests with significance of differences between the rear child and the driver or right-front passenger.
Supplemental Material
Download Zip (282.9 KB)Data availability statement
The crash test movies, data and reports are available from the NHTSA website (https://www.nhtsa.gov/research-data/research-testing-databases#/) using the test number (#) as a guide. Additional information on the data analysis can be requested of the author at [email protected].