Figures & data
Figure 1. The Active SHBM seated in a reclined posture, 50° from the vertical axis, on the semi-rigid seat model with two different seatbelt geometries: BIS (black belt textile) and BPI (gray belt textile). Note: the BIS and BPI simulations were run separately. They are shown in the same figure only for comparison. For the BPI seatbelt geometry, the right arm of the HBM is outboard of the vertical portion of the 2D seatbelt. As this is not reasonable, no contact was defined between the 2D seatbelt and the arm to avoid problems with the initial configuration.
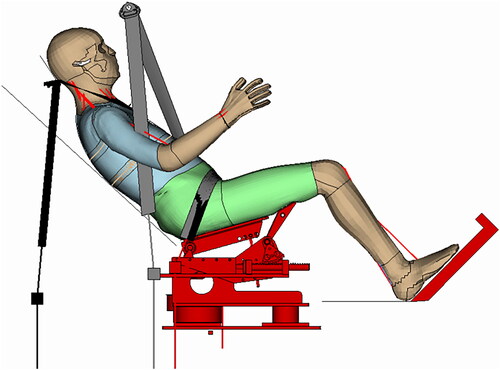
Figure 2. Seatbelt forces from the (a) shoulder belt, (b) buckle attachment, and (c) lap belt only for the crash phase of the simulation.
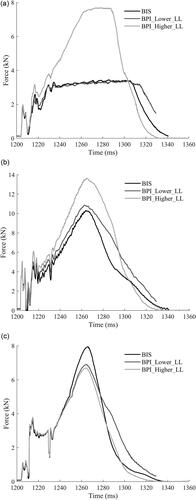
Figure 3. Frontal displacements of the (a) head, (b) T1, (c) L1, and (d) pelvis across the entire timeline of the whole-sequence frontal crash.
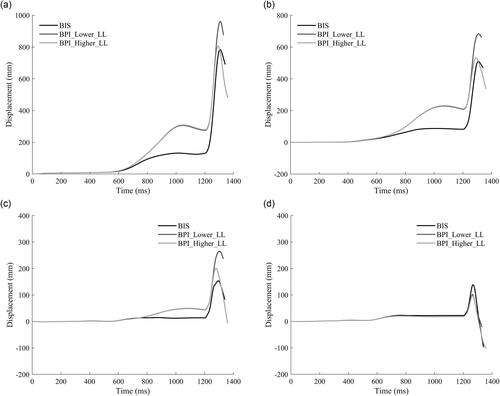
Figure 4. The pelvis y-rotations across the entire timeline of the whole-sequence frontal crash.
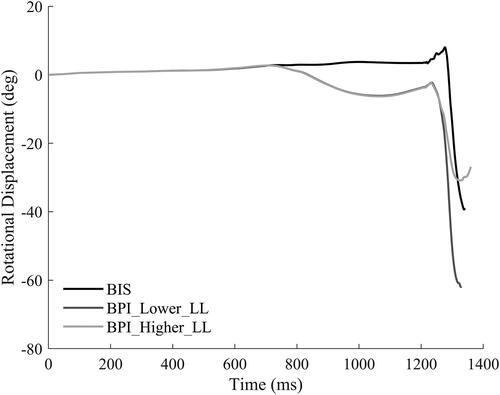
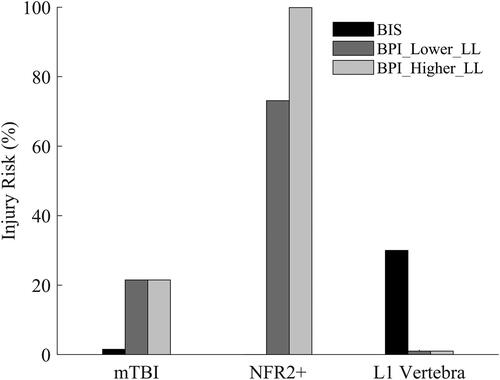
Figure 5. Comparison of mTBI, NFR2+, and L1 vertebra fracture risks.