
Figures & data
Figure 1. Example problems from each condition.
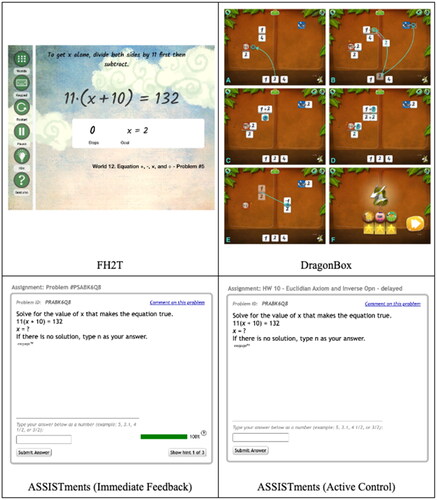
Table 1. Student-level dosage and engagement fidelity variables aggregated from each program’s log-file data.
Table 2. Means, standard deviations, and ANOVA statistics of student-level fidelity variables by condition.
Table 3. Intra-class correlations of student-level fidelity metrics by implementation context.
Figure 2. Boxplots of total problems attempted standardized within condition by teacher. This visualization displays the variance in problems attempted across teachers and schools. There is extensive variation in the number of problems students completed across teachers, with some teachers’ students averaging under one standard deviation below the grand mean and others averaging one and half standard deviations above the grand mean.
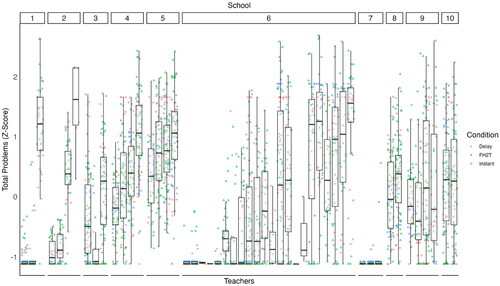
Figure 3. Plot comparing fit (as measured by BIC) across models with differing numbers of clusters and structure constraints.
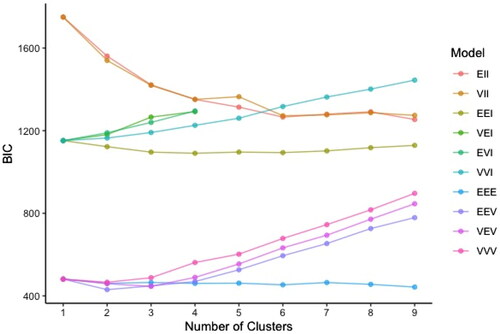
Figure 4. Boxplots and jittered scatter plots showing standardized means and standard deviations of averaged student-level fidelity metrics for high vs. low fidelity teachers. This figure shows the difference between high and low fidelity teachers on the fidelity metrics. High fidelity teachers had higher means on all metric showing that the model identified the teachers with higher usage students in the category. The high fidelity teachers also had higher standard deviations on assignments complete and total problems, suggesting more variability among students with these teachers. This was not the case for problems per assignment, in which low fidelity teachers had slightly higher standard deviations.
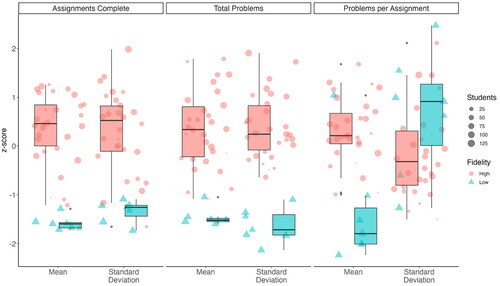
Table 4. Estimated model parameters from the mixture model and bootstrapped t-tests of statistical significance of model parameters between fidelity profiles.
Data availability statement
All data used for this study are available through the Open Science Foundation for those who fill out a data-sharing agreement (DSA) available here: https://osf.io/r3nf2/ (DOI 10.17605/OSF.IO/R3NF2). Once the DSA has been processed, researchers can access the data here: https://osf.io/2vftm/. Instructions for extracting the specific data used in this study are embedded within the R script found here: https://github.com/kirkvanacore/ImplementationFidelity_Analysis/blob/master/JCAL_IES_Fidelity_OPEN.Rmd. This script allows also allows researchers to completely reproduced the analyses presented in this article.