
Figures & data
Figure 1. Sandwich plate with FGM layer sandwiched between two piezoelectric layers.
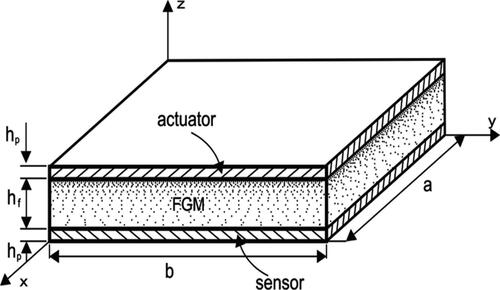
Table 1. Material properties of piezoelectric sensor and actuator (Alibeigloo Citation2010).
Figure 2. Distribution of transverse normal stress, shear stress, and deflection along the thickness direction for different half wave numbers (m, n), using 15 fictitious layers for the FGM core layer.
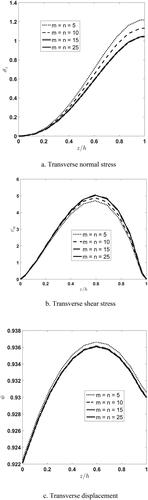
Table 2. Comparison of stresses and displacements of an elastic square FGM plate under a mechanical load.
Figure 3. Through-the-thickness distribution of the non-dimensional transverse normal stress, inplane normal stress, and transverse shear stress for different numbers of mathematical layers for the FGM core.
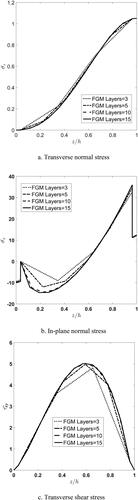
Figure 4. Effect of length to thickness ratio, a/h, on through-thickness distribution of nondimensional in-plane and transverse shear stresses and longitudinal displacement.
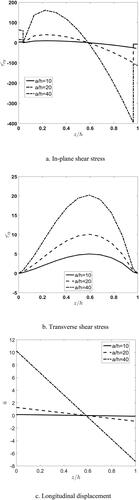
Figure 5. Effect of piezoelectric thick on distribution of non-dimensional in-plane and transverse shear stresses and longitudinal displacement.
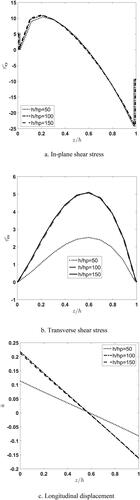
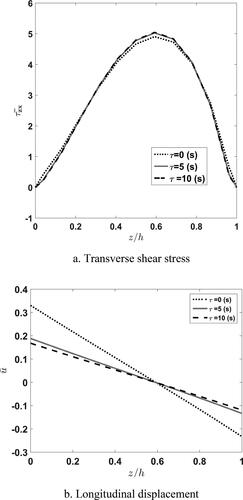
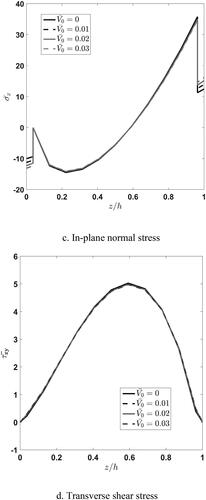
Figure 8. Time history of longitudinal displacement, transverse normal and shear stresses at the height of for different time constants.
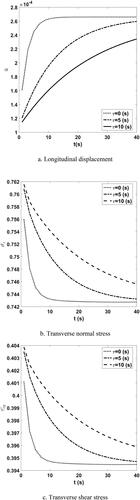
Table 3. Maximum stresses and displacements of the sandwich FGM plate in elastic () and viscoelastic (
) cases for different
ratio.