Figures & data
Figure 1. Raw rubber compound.
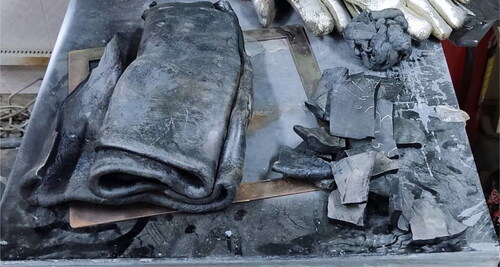
Table 1. Natural rubber ingredients.
Figure 2. Rubber rheometer test diagram.
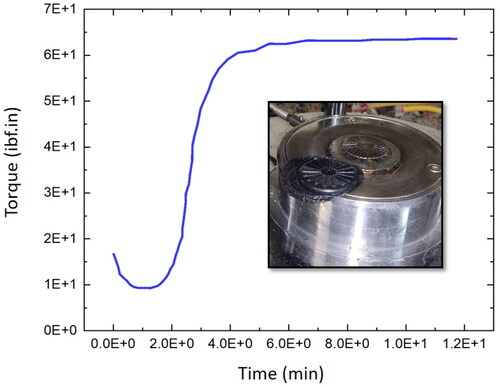
Figure 3. (a) Metal mold design and (b) steel mold and compound rubber.
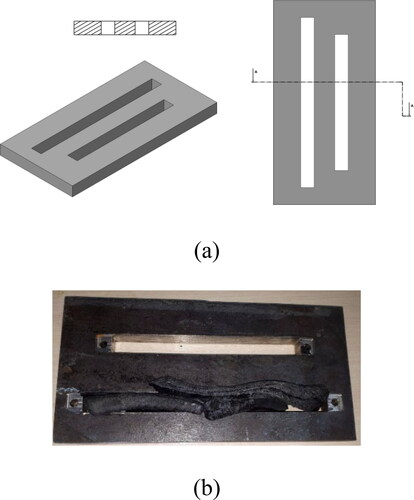
Figure 4. Steps of making a hyperelastic beam.
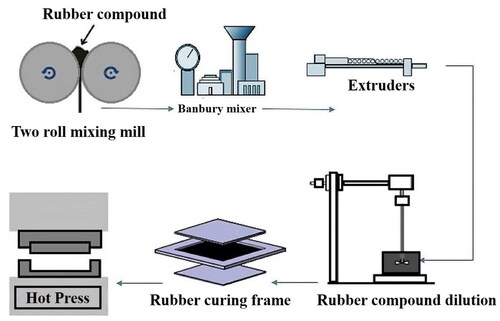
Figure 5. The uniaxial tensile test based on the ASTM D412 standard.
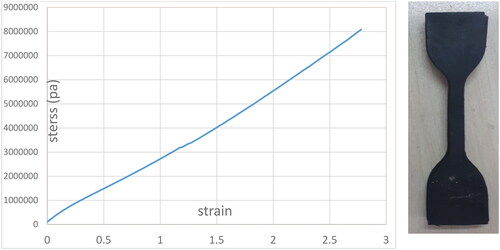
Figure 6. Overlap of experimental tensile test outcomes with strain energy functions.
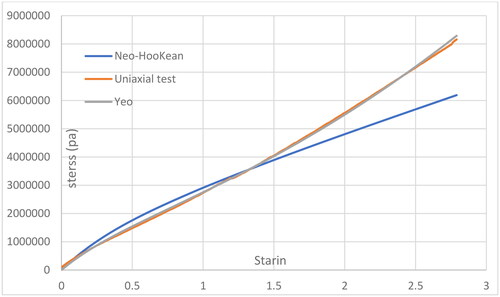
Table 2. Fixed coefficients of Yeoh and Neo-Hookean model (Khaniki et al. Citation2021; Khaniki et al. Citation2022b; Khaniki et al. Citation2022c).
Figure 7. Experimental test steps of DIC.
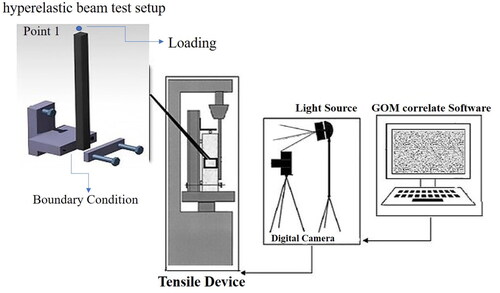
Figure 8. Experimental test of hyperelastic beams before and after loading.
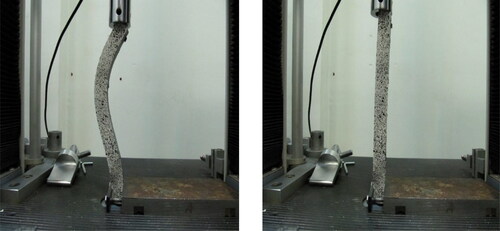
Figure 9. Boundary and loading conditions in the finite element model.
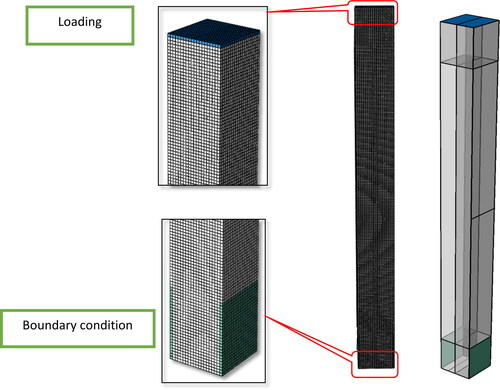
Figure 10. First three buckling modes.
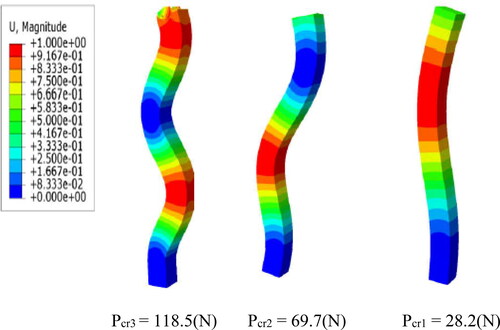
Figure 11. The X-axis displacement contour of the (a) experimental test (b) finite element of the beam.
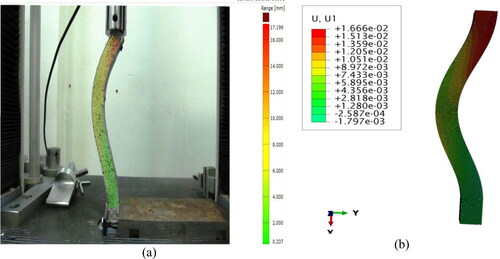
Figure 12. The Y-axis displacement contour of the (a) experimental test (b) finite element of the beam.
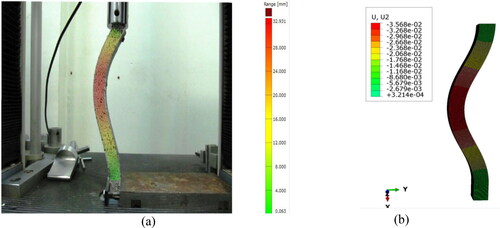
Figure 13. The force-displacement diagram of the experimental test and the FEM.
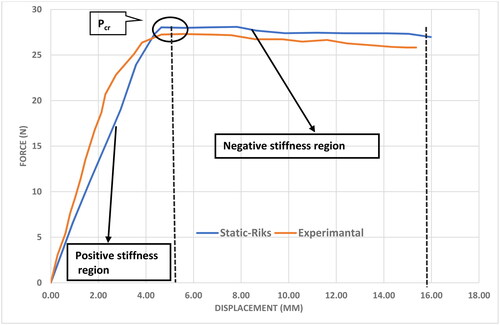
Figure 14. Strain contour of the (a) experimental test (b) finite element of the structure.
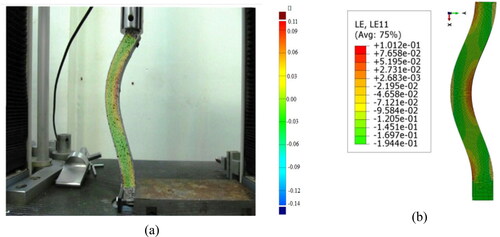
Figure 15. Variations of critical buckling load versus the material hardness coefficient.
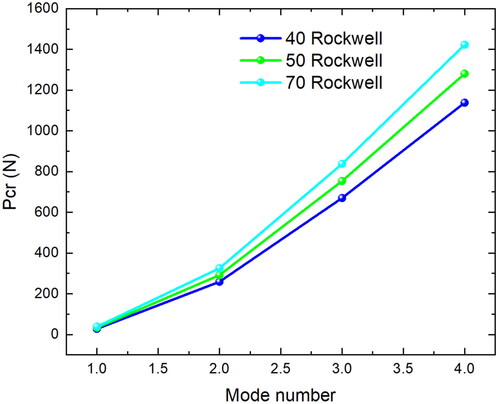
Figure 16. Variations of critical buckling load versus cross-section thickness.
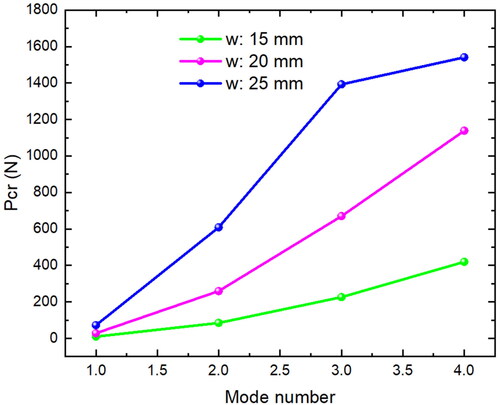
Figure 17. Variations of critical buckling load versus different lengths.
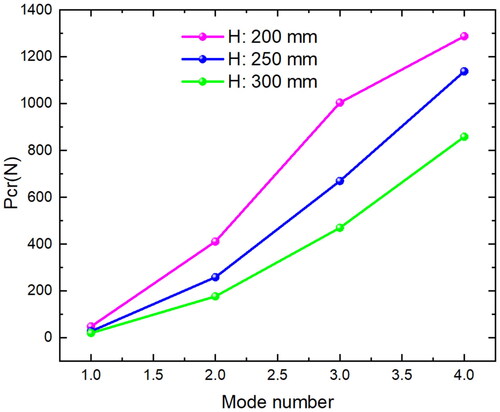
Figure 18. Variations of critical buckling force versus the eccentric loads.
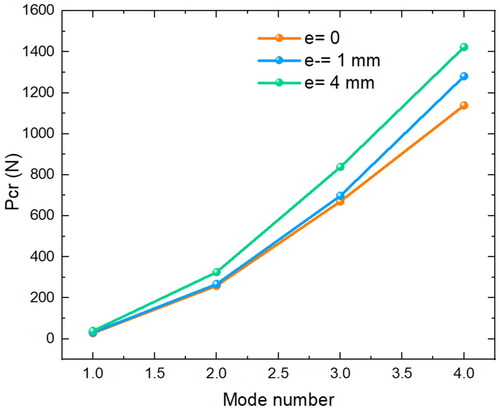
Table 3. Variations of linear eigenvalue versus geometry, material properties and eccentric loads.
Figure 19. The training, validation, test, and whole model performance evolution versus the Epoch number.
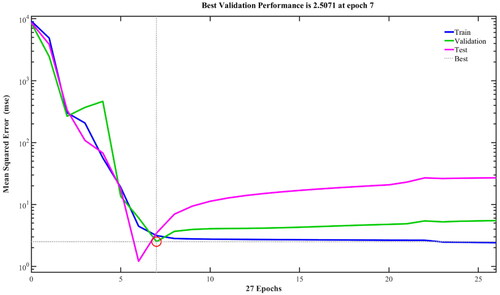
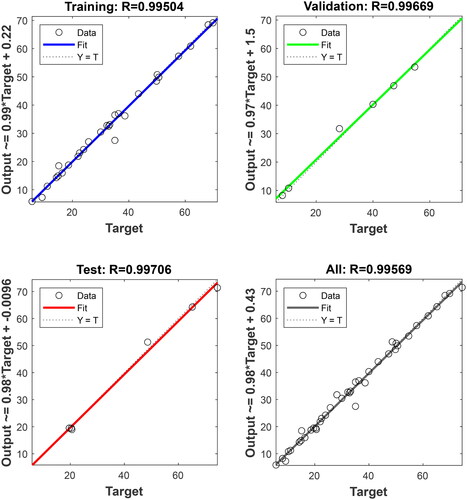
Figure 20. The regression schemes for four subsets: (a) training, (b) validation, (c) test, and (d) full evaluation.