Figures & data
TABLE 1 Demographic and Clinical Characteristics of MOOVD Participants
TABLE 2 Multilevel Models Predicting Physical Activity From Sleep Quality/Duration, and Vice Versa
Figure 1. We estimated the size and direction of the effect of sleep quality on subsequent physical activity for each individual by means of Best Linear Unbiased Prediction (BLUP). The x-axis represents size and direction of these estimated coefficients, with the number of participants on the y-axis. Example interpretation of the rightmost bar: for n = 2 individuals the predicted coefficient lies between 0.2 and 0.3, which suggests that an increase of 1 unit in sleep quality predicted a subsequent increase between 0.2 and 0.3 unit in physical activity in these individuals.
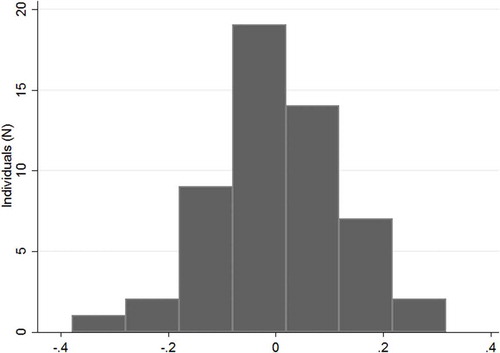
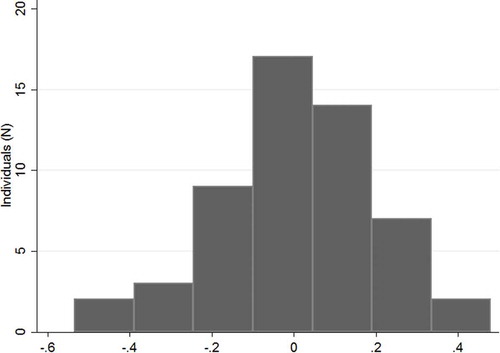
Figure 2. We estimated the size and direction of the effect of sleep duration on subsequent physical activity for each individual by means of Best Linear Unbiased Prediction (BLUP). The x-axis represents size and direction of these estimated coefficients, with the number of participants on the y-axis.