
Figures & data
Table 1. Psychosocial determinants proposed by health belief model with brief explanation.
Table 2. Demographics of sample that completed HBM-SW scale.
Table 3. Final scale items and results of factor anaylsis for Health Belief Model for Shift Workers Scale (HBM-SW).
Table 4. Measures of reliability outcomes presented by subscale.
Table 5. Correlations between HBM-SW subscales and outcome measures.
Figure 1. Visual representation of significant correlations between HBM-SW psychosocial determinants and health behaviors.
Note. This figure depicts significant correlations only. Left side of zero represents negative relationship: Higher levels of psychosocial determinant are associated with lower levels of health behavior. Right side of zero represents positive relationship: Higher levels of psychosocial determinant are associated with higher levels of health behavior. Beneficial health relationships (i.e., higher levels of positive health behaviors) are denoted with green bars, and poorer health relationships (i.e., higher levels of negative health behaviors) are denoted with red bars. Length of bars indicates strength on relationship (i.e., further from zero equals stronger relationship) *Higher scores of sleep quality indicate poorer sleep quality.
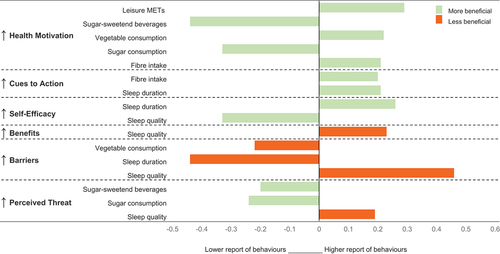
Table 6. Kruskal–Wallis tests between behavioral specific subscales (by low, average, high) and relevant outcomes of interest.
Supplemental material