
Figures & data
Figure 1. Annual inflation rates for the EAC countries (1996–2018).
Inflation rates are measured as the annual percentage change of the consumer price index. Stata version 15.1 was used to generate this figure. Source: World Development Indicators (World Bank , Citation2019).
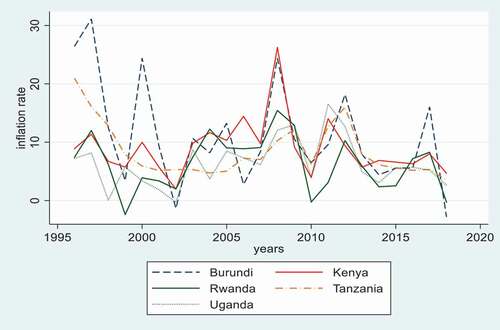
Table 1. Regression results based on the model in EquationEquation (10)(10)
(10)
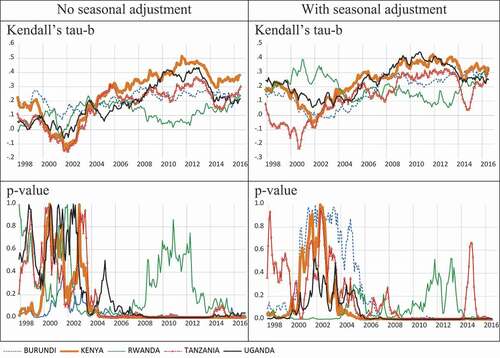
Figure 2. Rolling Kendall’s tau among EAC countries.
Rolling 5-year Kendall’s tau on monthly inflation between each EAC member and the other EAC members (weighted by GDP) (top) and p-values (bottom) representing significance from having zero correlation. The data used are from 1995:5 to 2018:12. The figure reports the information for the midpoint (31st month of 60 months) of the 5-year spans, with the starting digit of the year placed where the first month of that year stands.
Supplemental material