Figures & data
Figure 1. Market capitalization of the semiconductor and energy sectors, Jan 2020 - Jun 2021.
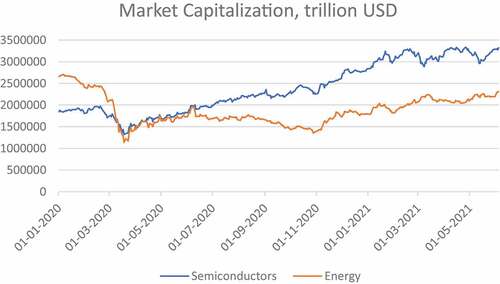
Table 1. Descriptive statistics for the MCI and the MSCI Semiconductor and Energy indices.
Table 2. Correlation Matrix.
Figure 2. Wavelet analysis: the MCI versus the MSCI World Semiconductor index (Semi).
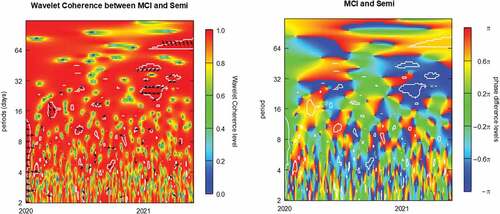
Figure 3. Wavelet analysis: the MCI vs. the MSCI World Semiconductor index volatility (S_vol).
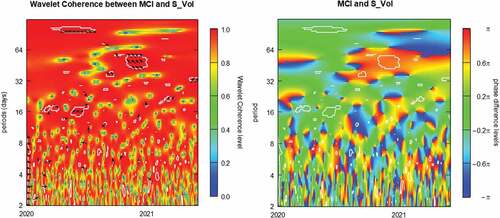
Figure 4. Wavelet analysis: the MCI versus the MSCI World Energy index (Energy).
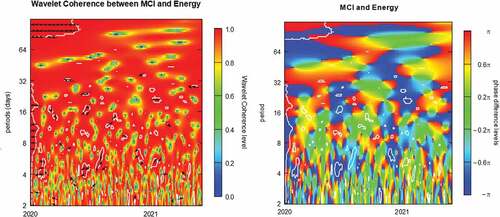
Figure 5. Wavelet analysis: the MCI vs. the MSCI World Energy index volatility (E_vol).
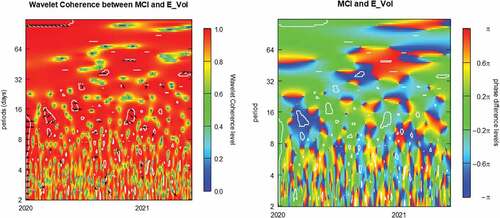
Figure 6. Wavelet analysis: the MSCI World Semiconductor (Semi) vs. World Energy (Energy) indices.
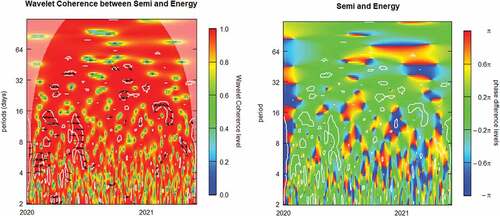
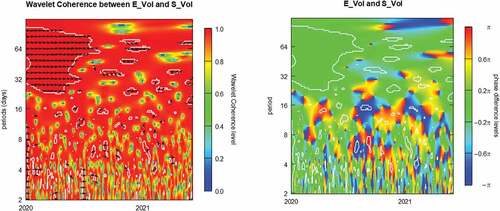
Figure 7. Wavelet analysis: Semiconductor index volatility (S_vol) vs. Energy index volatility (E_vol).