Figures & data
Figure 1 Four groups of mice were studied over an eight week time interval. Group 1 mice were exposed to cigarette smoke for 6 hours per day, 5 days per week. Group 2 mice had the same cigarette exposure as group 1 and additionally had Mycoplasma pneumoniae (Mp) respiratory infection induced at weeks 2 and 6. Group 3 mice only had Mp inoculations at weeks 2 and 6 while group 4 mice had saline inoculation at these time points. *All mice were sacrificed at week 8 for study analyses.
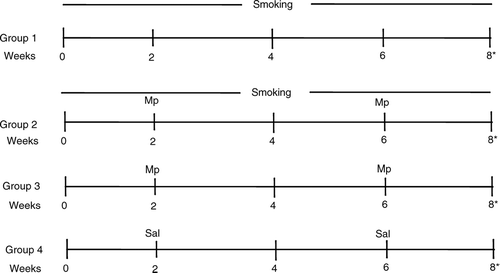
Table 1 Bronchoalveolar lavage cell counts
Figure 2 There is greater neutrophil degranulation (immunoperoxidase stain, arrows) in the outer wall of a small airway (diameter ≤ 200 μm) for a smoking plus Mp mouse (group 2) compared to a smoking without Mp mouse (group 1).
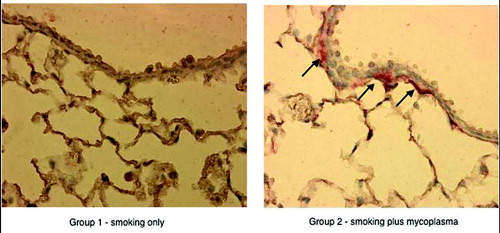
Table 2 Measurement of fixed and specific lung volume
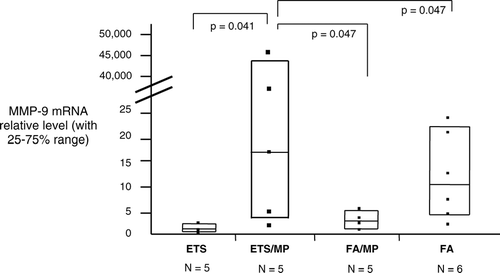
Figure 3 Lung tissue relative expression levels of MMP-9 mRNA by real-time RT-PCR. Group 1, smoking only is used as the baseline standard. Group 2, smoking plus Mp has a 10-fold increase in MMP-9 compared to group 1. Group 3 = Mp only and group 4 = saline control. Data expressed are medians with interquartile ranges. Group 2 is significantly increased compared to the other groups. Sample sizes are reduced due to RNA quality variability, only good quality accepted based on housekeeping gene 18sRNA.