Figures & data
Figure 1 T2 weighted axial MR images (HASTE) showing bronchial wall thickening of left upper lobe and lower lobes (arrow).
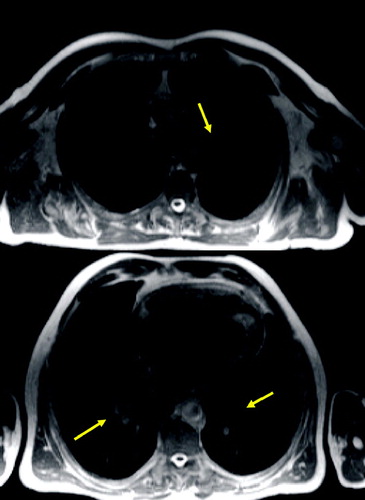
Figure 2 T1 weighted axial GRE (VIBE): small nodule in the right middle lobe (arrow) and dystelectatic changes in the right lower lobe.
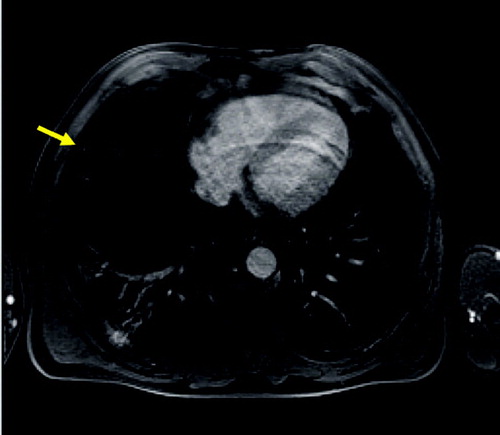
Figure 3 Axial T2 weighted MR (HASTE) image (A) and corresponding HRCT (B) showing severe panlobular emphysema and a large bulla (arrow). The rarefication of the pulmonary arteries and reduction of parenchyma are reflected by a general signal loss on MRI.

Figure 4 T1 weighted GRE (VIBE) post contrast (A) and corresponding HRCT (B): scar tissue (yellow arrows) and emphysematous bullae (green arrows) in the apical regions; centrilobular changes in the middle lobe and lingula (yellow asterisks), severe panlobular emphysema (green asterisks) in the lower lobes. Note the nice delineation between the centrilobular and panlobular changes by signal intensity (A, right image) on MRI.
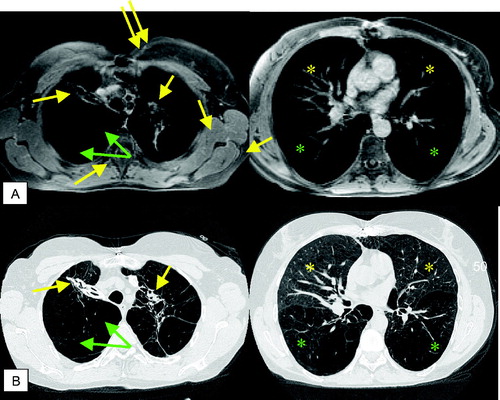
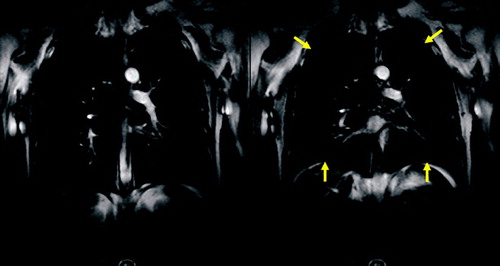
Figure 5 MR perfusion (10 mm MIP) of COPD patient showing a reduced perfusion of the lower lobes and normal perfusion of the upper lobes.
Figure 6 Coronal reformatted CT image and MR perfusion (10 mm MIP) of the patient suffering from severe emphysema showing a severe reduction of pulmonary perfusion and only marginal perfusion of the right basal and left subpleural regions.
Figure 7 Original and subtracted images of MR perfusion during inspiratory (A) and expiratory (B) breath-hold: loss of perfusion in lower lung regions and moderate perfusion of the upper regions with an increase in perfusion after expiration.
Figure 8 Parameter maps of quantitative analysis of MR perfusion acquired during inspiratory breath-hold: original image of time-resolved MR perfusion (A) showing severe perfusion defects in the lower lobes and normal perfusion in the right upper lobe; mean concentration (B); pulmonary blood flow (C) and pulmonary blood volume (D).
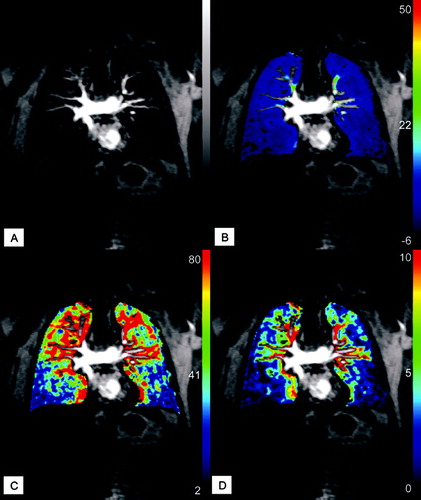
Figure 9 Quantitative flow measurement of pulmonary blood flow. Magnitude (A) and velocity encoded (B) image of pulmonary trunk (arrow). Results of peak velocity over time (C) show the normal increase of velocity at the beginning of systolic phase following by abnormal plateau and regurgitation during diastole.
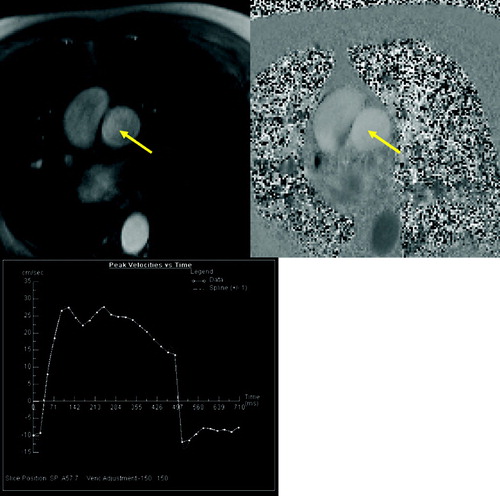
Figure 10 4-chamber view showing paradoxic septal movement during systole (arrow).
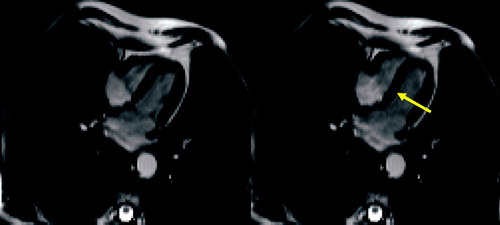
Figure 11 Coronal TrueFISP sequence with temporal resolution of 100 ms for assessment of the thoracic motion. Fast forced expiration (FEV1 manouver) starting from the maximum of inspiration (A) and ending at the maximum of expiration (B). Note the marginal difference of both images in the patient suffering from severe emphysema.