241
Views
7
CrossRef citations to date
0
Altmetric
ORIGINAL RESEARCH

Inhibition by Salmeterol and Cilomilast of Fluticasone-Enhanced IP-10 Release in Airway Epithelial Cells

, , , , &
Pages 5-11 | Published online: 02 Jul 2009

Figures & data

Figure 1 Effect of cytokines (TNF-α, IL-1β and IFN-γ) on IP-10 and IL-8 protein release. Cytokine treatment increased IP-10 (circles) and IL-8 (triangles) protein in epithelial cell-conditioned medium at 12 hr (open symbols) and 24 hr (closed symbols) (p < 0.001 versus vehicle for both IP-10 and IL-8 at 12 and 24 hr). Mean ± SEM of 5 experiments.
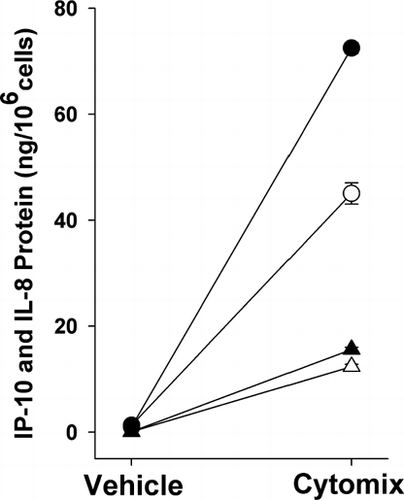
Figure 1 Effect of cytokines (TNF-α, IL-1β and IFN-γ) on IP-10 and IL-8 protein release. Cytokine treatment increased IP-10 (circles) and IL-8 (triangles) protein in epithelial cell-conditioned medium at 12 hr (open symbols) and 24 hr (closed symbols) (p < 0.001 versus vehicle for both IP-10 and IL-8 at 12 and 24 hr). Mean ± SEM of 5 experiments.

Figure 2 Effect of cytokines (TNF-α, IL-1β and IFN-γ) on IP-10 and IL-8 mRNA expression. Cytokine treatment increased IP-10 and IL-8 mRNA at 12 hr (black bars) and 24 hr (gray bars) as measured by real time RT-PCR. IP-10 and IL-8 mRNA are expressed as fold-change from control, where fold-change = 2 (control ct–chemokine ct). Mean ± SEM of 2–3 experiments.
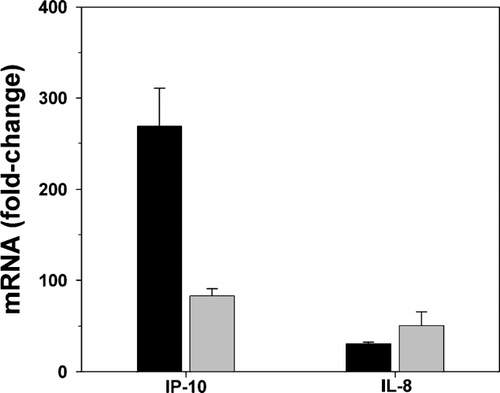
Figure 2 Effect of cytokines (TNF-α, IL-1β and IFN-γ) on IP-10 and IL-8 mRNA expression. Cytokine treatment increased IP-10 and IL-8 mRNA at 12 hr (black bars) and 24 hr (gray bars) as measured by real time RT-PCR. IP-10 and IL-8 mRNA are expressed as fold-change from control, where fold-change = 2 (control ct–chemokine ct). Mean ± SEM of 2–3 experiments.

Figure 3 Effect of fluticasone on cytokine-induced IP-10 and IL-8 protein. Fluticasone dose-dependently increased IP-10 (Panel A) and decreased IL-8 (Panel B) protein in cytokine-stimulated, airway epithelial cell-conditioned medium at 24 hr (p < 0.001 by 1-way RM ANOVA for both). Chemokine protein expressed as percent of control, i.e., cytokine-treated cells. Mean ± SEM of 5 experiments for each.
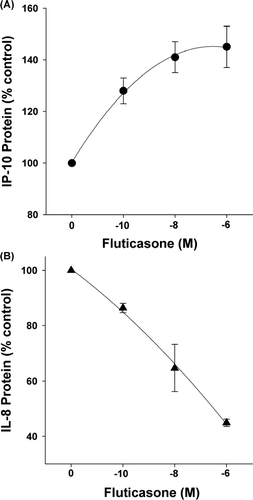
Figure 3 Effect of fluticasone on cytokine-induced IP-10 and IL-8 protein. Fluticasone dose-dependently increased IP-10 (Panel A) and decreased IL-8 (Panel B) protein in cytokine-stimulated, airway epithelial cell-conditioned medium at 24 hr (p < 0.001 by 1-way RM ANOVA for both). Chemokine protein expressed as percent of control, i.e., cytokine-treated cells. Mean ± SEM of 5 experiments for each.

Figure 4 Effect of fluticasone on cytokine-induced IP-10 and IL-8 mRNA. Fluticasone (12 hr) had no significant effect on IP-10 (p = 0.54) (Panel A) but reduced IL-8 mRNA (p < 0.04) (Panel B), as assessed by real-time RT-PCR. Mean ± SEM of 5 experiments.
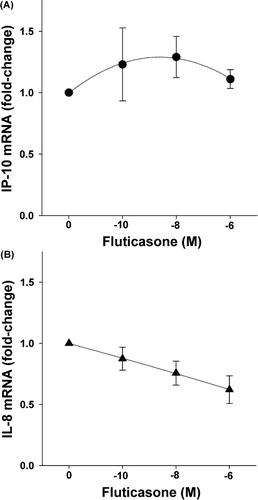
Figure 4 Effect of fluticasone on cytokine-induced IP-10 and IL-8 mRNA. Fluticasone (12 hr) had no significant effect on IP-10 (p = 0.54) (Panel A) but reduced IL-8 mRNA (p < 0.04) (Panel B), as assessed by real-time RT-PCR. Mean ± SEM of 5 experiments.

Figure 5 Effect of salmeterol and cilomilast on cytokine-induced IP-10 protein. Cells were stimulated with cytokines for 24 hr. Addition of cilomilast alone (0, 1 μ M, 10 μ M-open bars) during this time (24 hr) had no effect on IP-10. The addition of salmeterol (1 μ M for 24 hr-closed bars) to cilomilast inhibited IP-10 (* p = 0.013 by 1-way RM ANOVA). Mean ± SEM of 3 experiments.
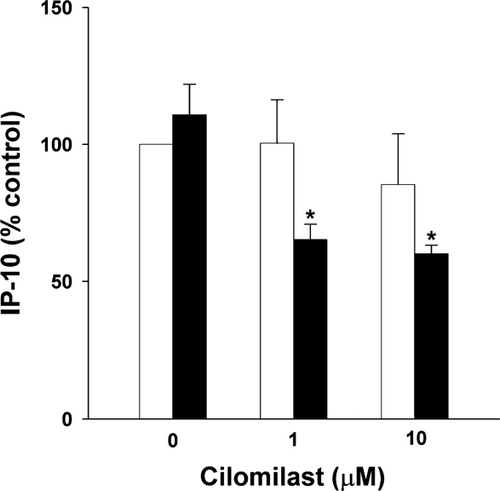
Figure 5 Effect of salmeterol and cilomilast on cytokine-induced IP-10 protein. Cells were stimulated with cytokines for 24 hr. Addition of cilomilast alone (0, 1 μ M, 10 μ M-open bars) during this time (24 hr) had no effect on IP-10. The addition of salmeterol (1 μ M for 24 hr-closed bars) to cilomilast inhibited IP-10 (* p = 0.013 by 1-way RM ANOVA). Mean ± SEM of 3 experiments.

Figure 6 Effect of salmeterol or dibutyryl cAMP on fluticasone-induced IP-10 and IL-8 Protein. Panel A: Cells were stimulated with cytokines for 24 hr. Addition of salmeterol (1 μ M-solid bars) or db-cAMP (1 mM-cross-hatched bars) during this time (24 hr) inhibited fluticasone-induced (10− 10 M-open bars) increases in IP-10 protein (* p = 0.013 for salmeterol and ** p < 0.001 for db-cAMP by 2-way RM ANOVA). Mean ± SEM of 3 experiments. Panel B: Neither salmeterol (solid bars) nor db-cAMP (cross-hatched bars) affected fluticasone-induced (open bars) decreases in IL-8 protein (p = 0.97 for salmeterol and p = 0.10 for db-cAMP by 2-way RM ANOVA). Mean ± SEM of 3 experiments.
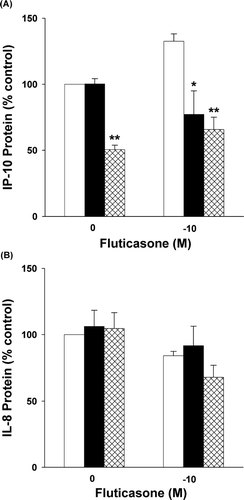
Figure 6 Effect of salmeterol or dibutyryl cAMP on fluticasone-induced IP-10 and IL-8 Protein. Panel A: Cells were stimulated with cytokines for 24 hr. Addition of salmeterol (1 μ M-solid bars) or db-cAMP (1 mM-cross-hatched bars) during this time (24 hr) inhibited fluticasone-induced (10− 10 M-open bars) increases in IP-10 protein (* p = 0.013 for salmeterol and ** p < 0.001 for db-cAMP by 2-way RM ANOVA). Mean ± SEM of 3 experiments. Panel B: Neither salmeterol (solid bars) nor db-cAMP (cross-hatched bars) affected fluticasone-induced (open bars) decreases in IL-8 protein (p = 0.97 for salmeterol and p = 0.10 for db-cAMP by 2-way RM ANOVA). Mean ± SEM of 3 experiments.

Reprints and Corporate Permissions

Please note: Selecting permissions does not provide access to the full text of the article, please see our help page How do I view content?

To request a reprint or corporate permissions for this article, please click on the relevant link below:

Academic Permissions

Please note: Selecting permissions does not provide access to the full text of the article, please see our help page How do I view content?

Obtain permissions instantly via Rightslink by clicking on the button below:

If you are unable to obtain permissions via Rightslink, please complete and submit this Permissions form. For more information, please visit our Permissions help page.