Figures & data
Figure 1 Distribution of lung function data. Panel A shows the distribution of forced expiratory volume in 1 second (FEV1), % predicted (n = 47). Panel B shows the distribution of forced vital capacity (FVC), % predicted (n = 47). Panel C shows the distribution of FEV1/FVC ratio (n = 49). Panel D shows the distribution of carbon monoxide diffusing capacity (DLCO), % predicted (n = 40).
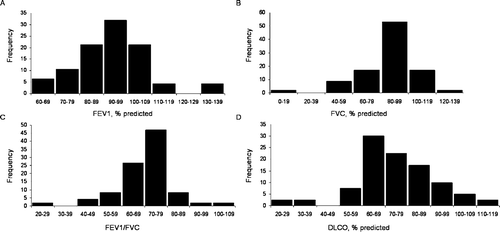
Table 1 Characteristics of subjects, smoking history, lung function data, distribution of emphysema score, and cellular content of bal fluid
Table 2 Primers and conditions for real-time PCR experiments
Figure 2 Comparison of matrix metalloproteinase 1 (MMP1) mRNA expression and emphysema. Panel A shows a plot comparing MMP1 expression with emphysema severity (current smokers, n = 8; former smokers, n = 12). Panel B shows a plot comparing MMP1 expression with emphysema severity, excluding the two outliers (current smokers, n = 7; former smokers, n = 11). The extent of severe emphysema was defined using a density mask cut-off of −950 Hounsfield units. Panel C shows a plot comparing MMP1 expression with emphysema extent (current smokers, n = 8; former smokers, n = 12). The overall extent of emphysema was defined using a density mask cut-off of −855 Hounsfield units.
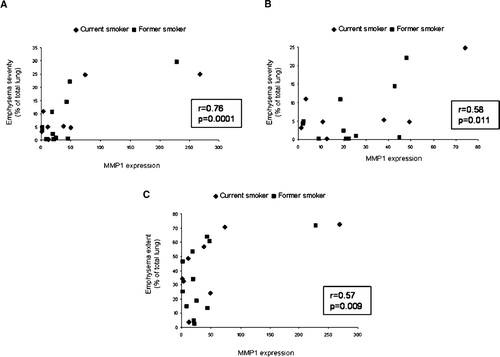
Figure 3 Matrix metalloproteinase 12 (MMP12) gene expression in current smokers and former smokers. Panel A shows the difference in levels of MMP12 mRNA expression, normalized according to the amount of beta-actin, in study participants who are current smokers (CS) (n = 24) and former smokers (FS) (study participants who had quit smoking for a least 6 months prior to surgery) (n = 29). Panel B shows the difference in levels of MMP12 expression in current smokers and former smokers classified according to the length of smoking cessation: (1) less than 10 years (FS < 10 yrs) (n = 13) or (2) greater than or equal to 10 years (FS > 10 yrs) (n = 16). The ends of the box are the first and third quartiles; the line across the middle of the box identifies the median.
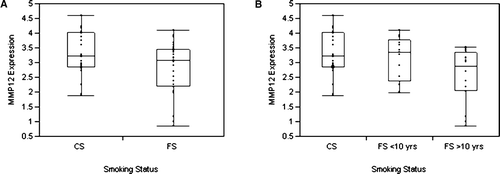
Figure 4 Baseline matrix metalloproteinase 12 (MMP12) mRNA expression and carbon monoxide diffusing capacity (DLCO). MMP12 expression was significantly inversely correlated with DLCO (r = −0.43, p = 0.006, n = 40).
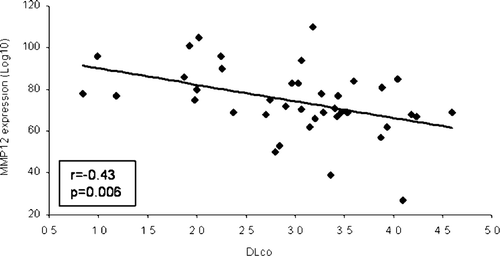
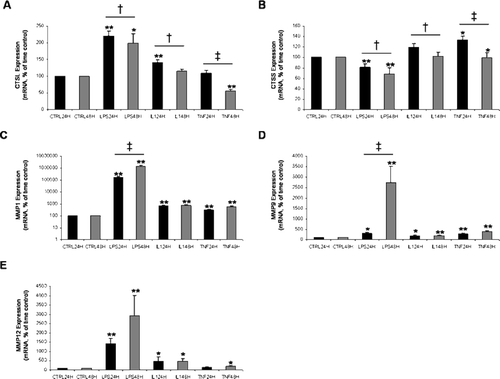
Figure 5 Relative gene expression in cultured alveolar macrophages. Alveolar macrophages were cultured for 24 h and 48 h in the presence of medium alone (CTRL), medium + lipopolysaccharide (LPS) (2 μ g/ml), medium + interleukin-1beta (IL-1beta) (20 ng/ml), or medium + tumor necrosis factor (TNF-alpha) (20 ng/ml). Panels A through E show the expression of cathepsin L (CTSL), cathepsin S (CTSS), matrix metalloproteinase 1 (MMP1), MMP9, and MMP12, respectively, with the use of real-time PCR. Samples from 54 subjects were run in triplicate. Data are means ± SE. *Statistically different compared with time control, p < 0.05. **Statistically different compared with time control, p < 0.001. † Statistically different between 24 h and 48 h, p < 0.05. ‡ Statistically different between 24 h and 48 h, p < 0.001. Note the log scale for levels of expression of MMP1.