Figures & data
Figure 1 CS exposure apparatus. The inlet of a modular incubator chamber was connected to a cigarette holder, and the outlet was connected to a vacuum line through a valve for adjustment of flow rates and an absorption unit. Culture dishes in the smoking chamber were exposed to whole CS generated by burning 2R4F cigarettes at a rate of 1 cigarette per 5 minutes. Cells in the control chamber were treated under identical conditions with an unlit cigarette.
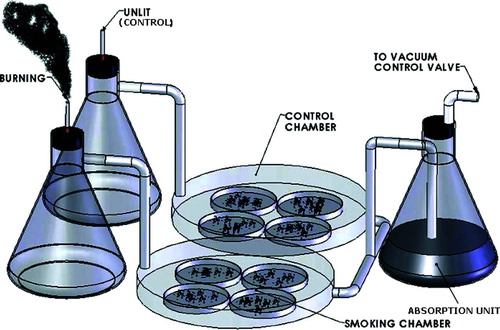
Figure 2 Visualization and quantification of Rhodamine (Rho) labeled AAT in PAEC. (A) Cells were incubated with Rho-labeled AAT (5 μ mol, 18 hours), fixed and mounted in the mounting medium with DAPI. Confocal microscopy micrographs demonstrate nuclei stained with DAPI (blue) and Rho (red) fluorescence of accumulated AAT. Magnification – 1000×. (B) Graph represents percentage of fluorescent cells (Rho-AAT positive) detected by flow cytometry. The initial bar represents Rho-AAT-(5 μ M, 18 hours) treated cells. The second and third bars are cells treated with Rho-AAT together with increasing concentrations of unlabeled AAT (25 and 50 μ M, respectively). Significance of the difference between cells treated with Rho-AAT plus 10-fold excess of cold AAT (50 μ M) versus Rho-AAT-only treated cells is indicated (p value of < 0.05 was taken as significant, n = 3).
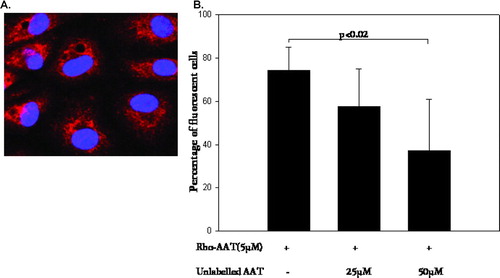
Figure 3 Apoptotic PAEC detected by confocal microscopy. Upper panel represents control cells, CS (18 cigarettes/6 hours) exposed cells, and AAT (20 μ M, 18 hours) pretreated/CS exposed cells stained with Annexin-FITC. The bottom panel represents control cells, CS-exposed cells and CS-exposed cells pretreated with AAT stained with an in situ marker for apoptosis, CaspACE FITC-VAD-FMK. Photomicrographs are representatives of at least 3 experiments. Magnification—400×.
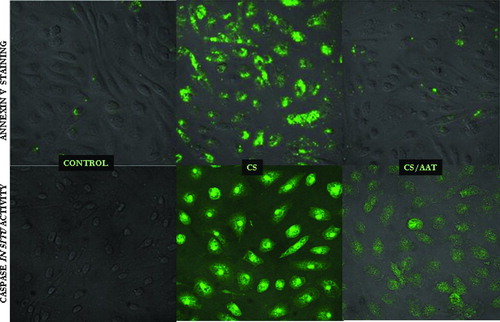
Figure 4 Annexin V-FITC positive/Propidium Iodine negative, i.e., apoptotic, cells detected by flow cytometry. Control cells are represented (first bar) and compared to CS-exposed (second bar) cells, AAT pretreated (20 μ M, 18 hours) and CS-exposed cells (third bar), and, cells treated with AAT but not exposed to CS (fourth bar). The flow cytometry insets above each column show cell distribution according to Annexin V and Propidium Iodine staining, where the lower right quadrant represents Propidium Iodine negative/Annexin V-positive, i.e., apoptotic cells. Significance of differences between the control (first bar) and CS-exposed cells (second bar) and between the CS-exposed (second bar) vs. AAT-treated/CS exposed cells (third bar) are indicated (n = 9).
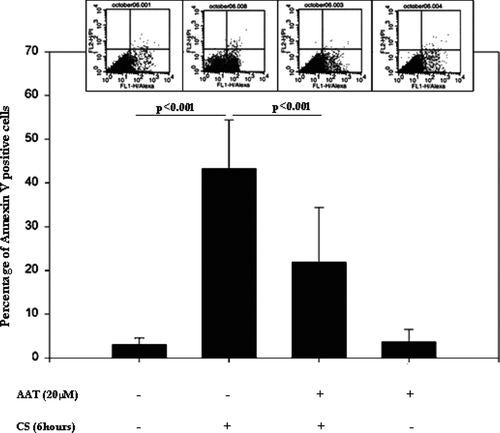
Figure 5 Co-localization of caveolin and AAT. (A) Western Blot of 12 membrane fractions derived from endothelial cells incubated with AAT (5 μ M, 18 hours) and probed with anti-Caveolin (upper panel) and anti-AAT (lower panel) antibodies is presented. Both AAT and caveolin are abundant in Lane 5 (5th fraction). AAT is also detected in fractions 9–12 where G-protein-coupled receptor (GPCR) binding components usually appear. Shown is a representative blot from 3 experiments. (B) Confocal microscopy images of AAT treated (5 μ M, 18 hours) PAEC were taken at 1000× magnification. Binding of primary antibodies to AAT and caveolin was visualized using Rhodamine- and FITC-conjugated secondary antibodies for AAT and caveolin, respectively. Yellow areas within the cells indicate co-localization of AAT and caveolin. Three identical experiments were performed.
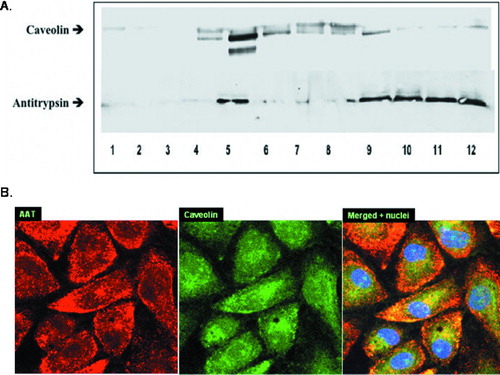
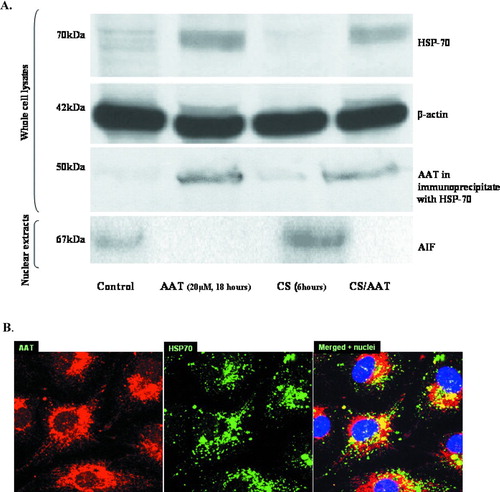
Figure 6 Internalized AAT modulates HSP-70 and AIF. (A) Western Blots of cytoplasmic HSP-70 (top panel), β-actin (second panel), precipitated HSP-70/AAT complexes (third panel) and nuclear AIF (fourth or bottom panel) are shown. Control, AAT-treated (20 μ M, 18 hours), CS-exposed (18 cigarettes/6 hours), and AAT-treated/CS-exposed cells are represented. Protein loading is comparable in all four lines as assessed by uniform β -actin staining (panel below). Co-immunoprecipitation with a specific HSP-70 antibody followed by Western Blot analysis was performed to determine the association of AAT and HSP-70 (the third panel from the top). Finally, AIF detected in the nuclear extracts of PAEC is presented in the bottom panel. Nuclear fractions were loaded by protein concentration (30 ng/well). Representative blots of at least 3 experiments are shown. (B) Confocal microscopic images of AAT-treated (5 μ M, 18 hours) PAEC (1000× magnification) are presented. Binding of primary antibodies to AAT and HSP-70 was visualized using Rhodamine- and FITC-conjugated secondary antibodies for AAT and HSP-70, respectively. Yellow areas within the cells indicate co-localization of proteins. Three identical experiments were performed.