403
Views
15
CrossRef citations to date
0
Altmetric
ORIGINAL RESEARCH

Time Course and Degree of Hyperinflation with Metronome-Paced Tachypnea in COPD Patients

, , , &
Pages 298-304 | Published online: 02 Jul 2009

Figures & data

Table 1 Patient characteristics

Figure 1 Time course and degree of dynamic hyperinflation produced by metronome paced tachypnea. There is a graded decline in IC corresponding to the graded increase in fR. For each fR the decline in IC occurs by 30 seconds and does not decline further by 60 seconds. The IC returns to baseline between episodes of paced tachypnea. The plot's horizontal line represents the median, the box encompasses the 25th to 75th percentile and the error bars encompass the 10th to the 90th percentile. Repeated Measures ANOVA P < 0.001. * p < 0.05 compared to Baseline 1. **P < 0.05 compared to Baseline 1 and fR 20/min (30s). *** p < 0.05 compared to Baseline 1, fR 20/min (30s and 60s), and fR 30/min (30s and 60s).
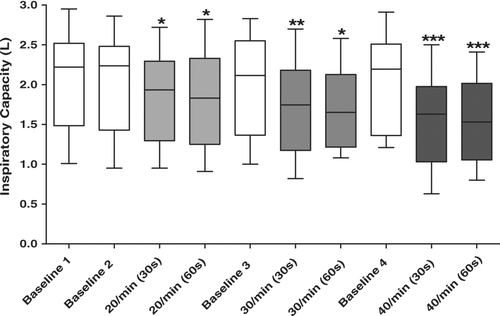
Figure 1 Time course and degree of dynamic hyperinflation produced by metronome paced tachypnea. There is a graded decline in IC corresponding to the graded increase in fR. For each fR the decline in IC occurs by 30 seconds and does not decline further by 60 seconds. The IC returns to baseline between episodes of paced tachypnea. The plot's horizontal line represents the median, the box encompasses the 25th to 75th percentile and the error bars encompass the 10th to the 90th percentile. Repeated Measures ANOVA P < 0.001. * p < 0.05 compared to Baseline 1. **P < 0.05 compared to Baseline 1 and fR 20/min (30s). *** p < 0.05 compared to Baseline 1, fR 20/min (30s and 60s), and fR 30/min (30s and 60s).

Table 2 Inspiratory capacity differences over time and between frequencies of respiration

Table 3 Respiratory rate and PETCO2 at baseline and following 60 seconds of metronome-paced tachypnea
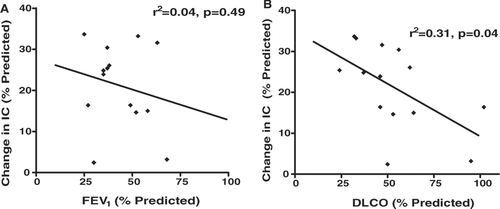
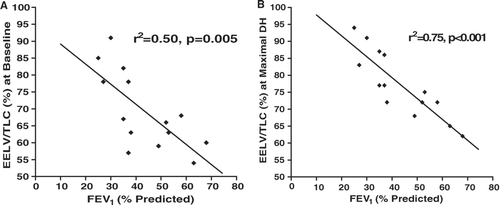
Figure 2 (A) Correlation between FEV1 percent predicted and change in inspiratory capacity (IC) percent of predicted. (B) Correlation between DLCO percent predicted and change in inspiratory capacity (IC) percent of predicted.

Figure 2 (A) Correlation between FEV1 percent predicted and change in inspiratory capacity (IC) percent of predicted. (B) Correlation between DLCO percent predicted and change in inspiratory capacity (IC) percent of predicted.

Figure 3 Correlation between FEV1 percent predicted and EELV expressed as a percent of TLC at baseline (A) and at maximal DH (fR 40/min x 30 secs) (B).

Figure 3 Correlation between FEV1 percent predicted and EELV expressed as a percent of TLC at baseline (A) and at maximal DH (fR 40/min x 30 secs) (B).

Reprints and Corporate Permissions

Please note: Selecting permissions does not provide access to the full text of the article, please see our help page How do I view content?

To request a reprint or corporate permissions for this article, please click on the relevant link below:

Academic Permissions

Please note: Selecting permissions does not provide access to the full text of the article, please see our help page How do I view content?

Obtain permissions instantly via Rightslink by clicking on the button below:

If you are unable to obtain permissions via Rightslink, please complete and submit this Permissions form. For more information, please visit our Permissions help page.