Figures & data
Figure 1 Schematic illustration of effects of an intervention on disease progression. Broken lines detail natural progression of a marker of disease progression; solid lines detail the change in this marker resulting from the intervention. (A) an intervention leading to a sustained change in the rate of progression that is maintained even after the intervention ceases; (B) an intervention leading to a sustained change in the rate of progression that occurs only during the time the therapy is administered; (C) an intervention that leads to a sustained improvement in a marker of disease status but has no effect on the rate of change of that marker over time; (D) an intervention that improves the marker of disease status during the time it is administered but provides no lasting effect on that marker once it is stopped.
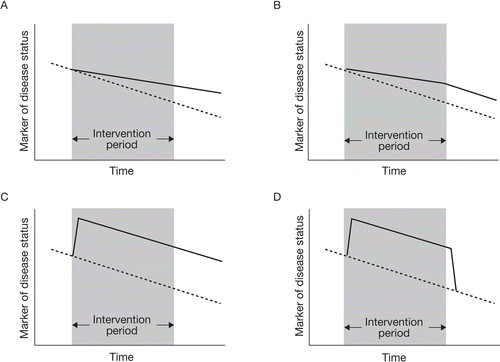
Table 1 Potential outcome measures that could be key markers of disease modification in COPD
Figure 2 Airway inflammatory response, as measured by the percentage of the airways containing polymorphonuclear neutrophils (PMNs), macrophages, and eosinophils, among patients at each Global Initiative for Chronic Obstructive Lung Disease (GOLD) stage (Citation[4]). Hogg JC, Chu F, Utokaparch S, Woods R, Elliott WM, Buzatu L, Cherniack RM, Rogers RM, Sciurba FC, Coxson HO, Paré PD. N Engl J Med 2004;350:2645–2653. Copyright © [2004] Massachusetts Medical Society. All rights reserved.
![Figure 2 Airway inflammatory response, as measured by the percentage of the airways containing polymorphonuclear neutrophils (PMNs), macrophages, and eosinophils, among patients at each Global Initiative for Chronic Obstructive Lung Disease (GOLD) stage (Citation[4]). Hogg JC, Chu F, Utokaparch S, Woods R, Elliott WM, Buzatu L, Cherniack RM, Rogers RM, Sciurba FC, Coxson HO, Paré PD. N Engl J Med 2004;350:2645–2653. Copyright © [2004] Massachusetts Medical Society. All rights reserved.](/cms/asset/9f3e6be0-0a4c-4332-96ed-b055b5d6046c/icop_a_392012_uf0002_b.gif)
Figure 3 Natural history of lung function decline in smokers and nonsmokers (Citation[13]). British Medical Journal, 1977,1,1645–1648, reproduced/amended with the permission from the BMJ publishing group.
![Figure 3 Natural history of lung function decline in smokers and nonsmokers (Citation[13]). British Medical Journal, 1977,1,1645–1648, reproduced/amended with the permission from the BMJ publishing group.](/cms/asset/1cd6ce9b-3c18-48fd-8134-254a49b791b3/icop_a_392012_uf0003_b.gif)
Figure 4 Effect of smoking cessation on the decline in lung function (forced respiratory volume in 1 second [FEV1] % predicted) over 5 years (Citation[16]). Scanlon PD, Connett JE, Waller LA, Altose MD, Bailey WC, Buist AS; Lung Health Study investigators/ 2000/ Smoking cessation and lung function in mild-to-moderate chronic obstructive pulmonary disease/ American Journal of Respiratory and Critical Care Medicine/ 161/381–390. Official Journal of the American Thoracic Society © American Thoracic Society.
![Figure 4 Effect of smoking cessation on the decline in lung function (forced respiratory volume in 1 second [FEV1] % predicted) over 5 years (Citation[16]). Scanlon PD, Connett JE, Waller LA, Altose MD, Bailey WC, Buist AS; Lung Health Study investigators/ 2000/ Smoking cessation and lung function in mild-to-moderate chronic obstructive pulmonary disease/ American Journal of Respiratory and Critical Care Medicine/ 161/381–390. Official Journal of the American Thoracic Society © American Thoracic Society.](/cms/asset/60cfe286-3d0f-4141-9d16-7760af0702e2/icop_a_392012_uf0004_b.gif)
Figure 5 Effect on forced respiratory volume in 1 second (FEV1) of salmeterol and fluticasone propionate administered either alone or in combination versus placebo over 156 weeks (Citation[24]). Calverley PM, Anderson JA, Celli B, Ferguson GT, Jenkins C, Jones PW, Yates JC, Vestbo J; TORCH investigators. N Engl J Med 2007;356:775–789. Copyright © [2007] Massachusetts Medical Society. All rights reserved.
![Figure 5 Effect on forced respiratory volume in 1 second (FEV1) of salmeterol and fluticasone propionate administered either alone or in combination versus placebo over 156 weeks (Citation[24]). Calverley PM, Anderson JA, Celli B, Ferguson GT, Jenkins C, Jones PW, Yates JC, Vestbo J; TORCH investigators. N Engl J Med 2007;356:775–789. Copyright © [2007] Massachusetts Medical Society. All rights reserved.](/cms/asset/2704d294-536a-4b13-a470-1811b76edd43/icop_a_392012_uf0005_b.gif)
Figure 6 Effect of tiotropium on trough forced expiratory volume in 1 second (FEV1) following treatment with tiotropium or administration with placebo from (A) Days 8–355 and (B) Days 50–344 (Citation[26]). Reprinted from Pulmonary Pharmacology and Therapeutics, 18, Anzueto A, Tashkin D, Menjoge S, Kesten S, One-year analysis of longitudinal changes in spirometry in patients with COPD receiving tiotropium, 75–81., Copyright (2005), with permission from Elsevier.
![Figure 6 Effect of tiotropium on trough forced expiratory volume in 1 second (FEV1) following treatment with tiotropium or administration with placebo from (A) Days 8–355 and (B) Days 50–344 (Citation[26]). Reprinted from Pulmonary Pharmacology and Therapeutics, 18, Anzueto A, Tashkin D, Menjoge S, Kesten S, One-year analysis of longitudinal changes in spirometry in patients with COPD receiving tiotropium, 75–81., Copyright (2005), with permission from Elsevier.](/cms/asset/d765d0fb-c276-40ce-903f-9b5ef54fae73/icop_a_392012_uf0006_b.gif)
Figure 7 Air trapping links pathophysiology and patient-centered outcomes in COPD (Citation[37]). Reprinted from American Journal of Medicine, 119, Cooper CB, The connection between chronic obstructive pulmonary disease symptoms and hyperinflation and its impact on exercise and function, S21–S31., Copyright (2006), with permission from Elsevier.
![Figure 7 Air trapping links pathophysiology and patient-centered outcomes in COPD (Citation[37]). Reprinted from American Journal of Medicine, 119, Cooper CB, The connection between chronic obstructive pulmonary disease symptoms and hyperinflation and its impact on exercise and function, S21–S31., Copyright (2006), with permission from Elsevier.](/cms/asset/5ff75ba2-9bc4-458b-966f-a517a7e0c741/icop_a_392012_uf0007_b.gif)
Figure 8 Slope of deterioration in health status calculated using estimates from a random coefficients hierarchical model for patients treated with fluticasone proprionate or placebo over 3 years (Citation[49]). Spencer S, Calverley PM, Sherwood Burge P, Jones PW; ISOLDE Study Group/ 2001/ Health status deterioration in patients with chronic obstructive pulmonary disease/ American Journal of Respiratory and Critical Care Medicine/ 163/ 122–128. Official Journal of the American Thoracic Society © American Thoracic Society.
![Figure 8 Slope of deterioration in health status calculated using estimates from a random coefficients hierarchical model for patients treated with fluticasone proprionate or placebo over 3 years (Citation[49]). Spencer S, Calverley PM, Sherwood Burge P, Jones PW; ISOLDE Study Group/ 2001/ Health status deterioration in patients with chronic obstructive pulmonary disease/ American Journal of Respiratory and Critical Care Medicine/ 163/ 122–128. Official Journal of the American Thoracic Society © American Thoracic Society.](/cms/asset/6a59d861-7d5f-474c-aaec-831d177bbf34/icop_a_392012_uf0008_b.gif)
Figure 9 Change in Health-related Quality of Life (HRQoL) over 156 weeks following treatment with placebo, fluticasone proprionate, salmeterol or fluticasone proprionate and salmeterol administered in combination (Citation[24]). Calverley PM, Anderson JA, Celli B, Ferguson GT, Jenkins C, Jones PW, Yates JC, Vestbo J; TORCH investigators. N Engl J Med 2007;356:775–789. Copyright © [2007] Massachusetts Medical Society. All rights reserved.
![Figure 9 Change in Health-related Quality of Life (HRQoL) over 156 weeks following treatment with placebo, fluticasone proprionate, salmeterol or fluticasone proprionate and salmeterol administered in combination (Citation[24]). Calverley PM, Anderson JA, Celli B, Ferguson GT, Jenkins C, Jones PW, Yates JC, Vestbo J; TORCH investigators. N Engl J Med 2007;356:775–789. Copyright © [2007] Massachusetts Medical Society. All rights reserved.](/cms/asset/900c249e-3d59-4ca1-ae3a-39b38265e160/icop_a_392012_uf0009_b.gif)
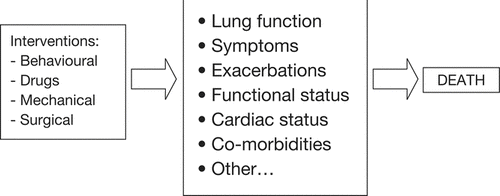
Figure 10 Direct and indirect ways by which interventions impact on mortality.