
Figures & data
Table 1. Characteristics of the study population.
Figure 1. Scatter of CAT scores with mean ± SD in patients with different mMRC grades of dyspnoea (Kruskal–Wallis analysis of variance, p < 0.0001). For post hoc paired comparisons, see text.
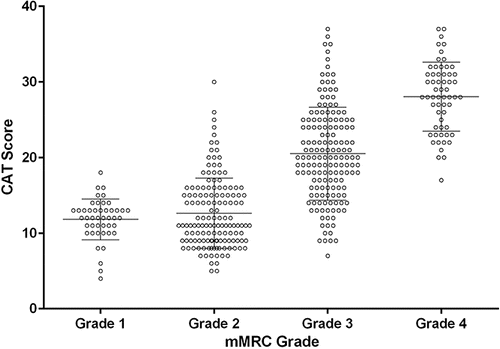
Figure 2. Proportion of patients with low (<10) and high (≥10) CAT scores among groups by mMRC grades (chi square test, p < 0.0001).
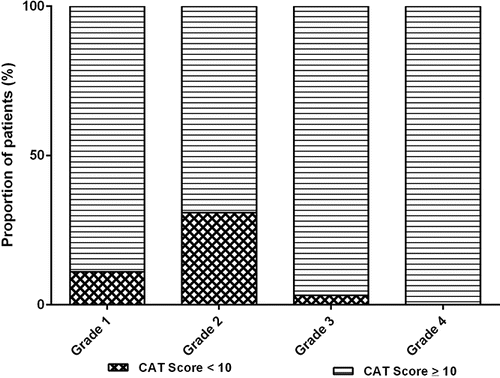
Table 2. Distribution of patients using mMRC or CAT scores.
Table 3. Receiver operator characteristic analysis results.
Figure 3. Receiver operator characteristic curve of different cut-offs of CAT score to identify patients with mMRC ≥ 2. The optimal combination of sensitivity and specificity was obtained with a CAT score of 17 and is shown by an arrow.
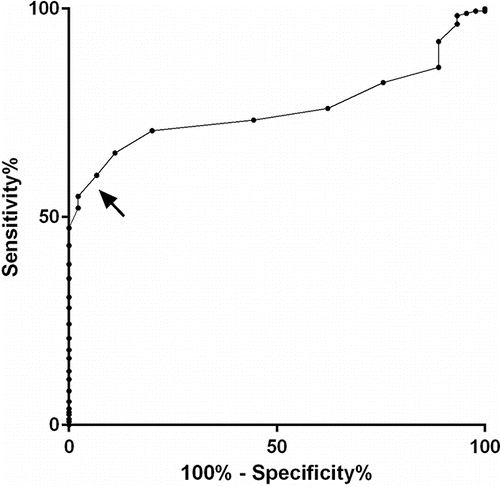
Table 4. Distribution of patients using mMRC or modified CAT score cut-off of 17.
Figure 4. Frequency of exacerbations (Exac.) and hospitalisations (hosp.) across the old GOLD stages (ANOVA: F 9.718, p < 0.0001 and F 9.017, p < 0.0001, respectively). For post-hoc paired comparisons, see text.
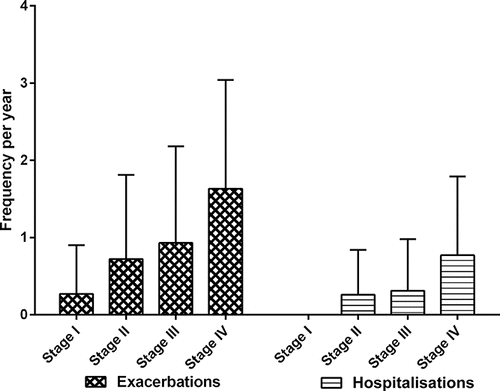
Table 5. Distribution of patients using GOLD stage and frequency of exacerbations.