1,115
Views
5
CrossRef citations to date
0
Altmetric
ORIGINAL RESEARCH

Advances in Identifying Urine/Serum Biomarkers in Alpha-1 Antitrypsin Deficiency for More Personalized Future Treatment Strategies

, , , , , & show all
Pages 56-65 | Received 30 Mar 2016, Accepted 18 Sep 2016, Published online: 09 Nov 2016

Figures & data

Figure 1. Determination of desmosines in urine samples from AATD patients, obtained by applying CE-UV; CE-LIF; and LC–MS (bottom to top, respectively). Electropherograms/chromatograms reported are representative of those generated with the mentioned approaches, in the years indicated in the figure. Bottom: CE-UV profile. Peaks 1 and 2 represent IDES and DES, respectively. Experimental conditions: approximately 10 nL was injected into an uncoated fused-silica capillary (57 cm × 50 µm i.d.). Electrolyte background: 35 mM sodium tetraborate pH 9.3 containing 65 mM SDS. Applied voltage: 10 kV. Temperature: 25°C. Middle: CE-LIF electropherogram obtained from a diluted urine sample (approximately 10 nL) derivatized with FITC. Peak 1 represents endogenous desmosines (IDES plus DES) and peak IS corresponds to the internal standard (FITC-Asn). The peak indicated by an arrow represents the excess FITC. Inset: expansion of the square region containing peak 1. Experimental conditions: uncoated capillary (57 cm × 50 µm i.d). Electrolyte background: 20 mM sodium tetraborate pH 9.0 containing 60 mM SDS and 15% v/v methanol. Applied voltage: 30 kV. Temperature: 25°C. The laser module consisted of a 3 mW and a 488 nm air-cooled argon-ion laser with an emission band pass filter of 520 ± 2 nm. Top: LC-MS profile (panel A) obtained from a UPLC column (2.1 × 100 mm, 1.8 μm pore size) using a 7-min gradient from 99.5% of solvent A (5 mM ammonium formate containing 0.1% formic acid) to 90% solvent B (methanol containing 0.1% formic acid and 5 mM ammonium formate) at a flow rate of 0.5 mL/min. The sample volume injected was 10 μL. Panel B: multiple reaction monitoring (MRM) transition 526 > 397 of the desmosine peak (indicated by an arrow in panel A) was selected for quantitative and qualitative analyses, respectively.
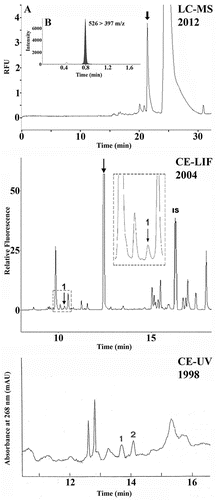
Figure 1. Determination of desmosines in urine samples from AATD patients, obtained by applying CE-UV; CE-LIF; and LC–MS (bottom to top, respectively). Electropherograms/chromatograms reported are representative of those generated with the mentioned approaches, in the years indicated in the figure. Bottom: CE-UV profile. Peaks 1 and 2 represent IDES and DES, respectively. Experimental conditions: approximately 10 nL was injected into an uncoated fused-silica capillary (57 cm × 50 µm i.d.). Electrolyte background: 35 mM sodium tetraborate pH 9.3 containing 65 mM SDS. Applied voltage: 10 kV. Temperature: 25°C. Middle: CE-LIF electropherogram obtained from a diluted urine sample (approximately 10 nL) derivatized with FITC. Peak 1 represents endogenous desmosines (IDES plus DES) and peak IS corresponds to the internal standard (FITC-Asn). The peak indicated by an arrow represents the excess FITC. Inset: expansion of the square region containing peak 1. Experimental conditions: uncoated capillary (57 cm × 50 µm i.d). Electrolyte background: 20 mM sodium tetraborate pH 9.0 containing 60 mM SDS and 15% v/v methanol. Applied voltage: 30 kV. Temperature: 25°C. The laser module consisted of a 3 mW and a 488 nm air-cooled argon-ion laser with an emission band pass filter of 520 ± 2 nm. Top: LC-MS profile (panel A) obtained from a UPLC column (2.1 × 100 mm, 1.8 μm pore size) using a 7-min gradient from 99.5% of solvent A (5 mM ammonium formate containing 0.1% formic acid) to 90% solvent B (methanol containing 0.1% formic acid and 5 mM ammonium formate) at a flow rate of 0.5 mL/min. The sample volume injected was 10 μL. Panel B: multiple reaction monitoring (MRM) transition 526 > 397 of the desmosine peak (indicated by an arrow in panel A) was selected for quantitative and qualitative analyses, respectively.

Figure 2. Role of plasma AAT as a fatty acid (FA) binding and transporting protein. AAT binds unsaturated FAs and can deliver FA into tissues and cells. Within the cell, FA rapidly binds intracellular fatty acid binding proteins (FABPs) in the cytosol, enters the nucleus, and induces expression of Angptl4 via activation of HIF-1 and the peroxisome proliferator-activated receptors (PPARs) pathways. Angptl4 is an inhibitor of lipoprotein lipase (LPL). Therefore, the FA-bound form of AAT might indirectly contribute to LPL inhibition (black line) leading to reduced triglyceride (TG) hydrolysis by circulating chylomicrons (CM) and very-low-density lipoproteins (VLDL, and to diminished uptake of TG-derived FAs. AAT-FA-mediated upregulation of CD36 and FABPs expression indicates the Angptl4-related switch in fuel utilization toward the use of AAT bound FAs (blue arrows).
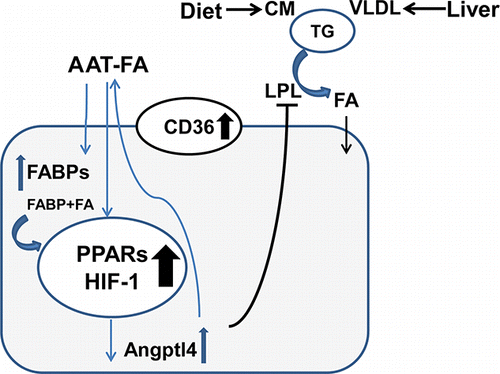
Figure 2. Role of plasma AAT as a fatty acid (FA) binding and transporting protein. AAT binds unsaturated FAs and can deliver FA into tissues and cells. Within the cell, FA rapidly binds intracellular fatty acid binding proteins (FABPs) in the cytosol, enters the nucleus, and induces expression of Angptl4 via activation of HIF-1 and the peroxisome proliferator-activated receptors (PPARs) pathways. Angptl4 is an inhibitor of lipoprotein lipase (LPL). Therefore, the FA-bound form of AAT might indirectly contribute to LPL inhibition (black line) leading to reduced triglyceride (TG) hydrolysis by circulating chylomicrons (CM) and very-low-density lipoproteins (VLDL, and to diminished uptake of TG-derived FAs. AAT-FA-mediated upregulation of CD36 and FABPs expression indicates the Angptl4-related switch in fuel utilization toward the use of AAT bound FAs (blue arrows).

Table 1. Characteristics of different biomarkers.

Reprints and Corporate Permissions

Please note: Selecting permissions does not provide access to the full text of the article, please see our help page How do I view content?

To request a reprint or corporate permissions for this article, please click on the relevant link below:

Academic Permissions

Please note: Selecting permissions does not provide access to the full text of the article, please see our help page How do I view content?

Obtain permissions instantly via Rightslink by clicking on the button below:

If you are unable to obtain permissions via Rightslink, please complete and submit this Permissions form. For more information, please visit our Permissions help page.