Figures & data
Table 1. Baseline characteristics of the patients based on the presence of poor outcome at 3 months after hospital discharge.
Figure 1. Prevalence of the different variables calculated using the cut-off point with the greatest predictive power. FEV1, maximum expiratory volume in the first second; mMRC, modified Medical Research Council dyspnea scale; PCO2, partial pressure of carbon dioxide; LTOT, long-term oxygen therapy; Hb, hemoglobin; CRP, C-reactive protein; CAT: COPD assessment test. *indicates p < 0.05.
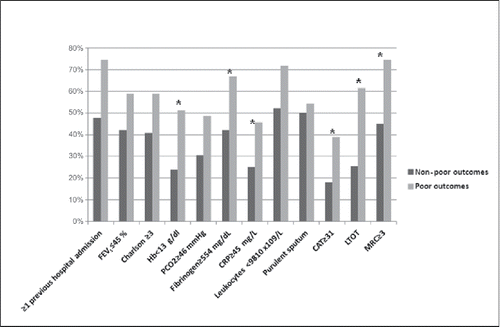
Table 2. Univariate and multivariate logistic regression models for predicting poor patient outcomes.
Table 3. Model 1: C-reactive protein (CRP) ≥ 45 g/L, hemoglobin (Hb) < 13 g/L and long-term oxygen therapy (LTOT) and COPD assessment test (CAT) ≥ 31.
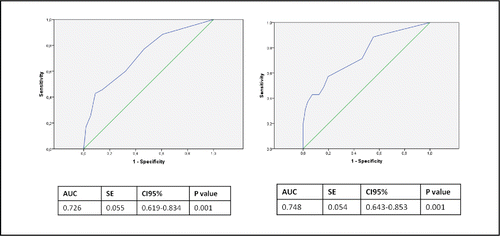
Figure 2. ROC analysis of significant variables derived from the logistic regression models and their capacity to predict poor outcome at 3 months. (A) Model 1 includes C-reactive protein (CRP) ≥ 45, hemoglobin (Hb) < 13 and long-term oxygen therapy (LTOT). (B) Model 2 includes C-reactive protein (CRP) ≥ 45, hemoglobin (Hb) < 13, long-term oxygen therapy (LTOT) and the COPD assessment test (CAT) ≥ 31. AUC, area under the curve; SE, standard error.