2,066
Views
30
CrossRef citations to date
0
Altmetric
Original Research

Eosinophilic and Neutrophilic Airway Inflammation in the Phenotyping of Mild-to-Moderate Asthma and Chronic Obstructive Pulmonary Disease

, , , &
Pages 181-189 | Received 25 May 2016, Accepted 09 Nov 2016, Published online: 16 Dec 2016

Figures & data

Table 1. Clinical characteristics of patients with asthma and chronic obstructive pulmonary disease participating in the study.

Table 2. Mediator concentrations and cell numbers in serum/blood and induced sputum from asthma and COPD patients.

Figure 1. Correlations between blood and sputum eosinophils (red triangles) and blood and sputum neutrophils (black circles) in asthma and COPD patients.
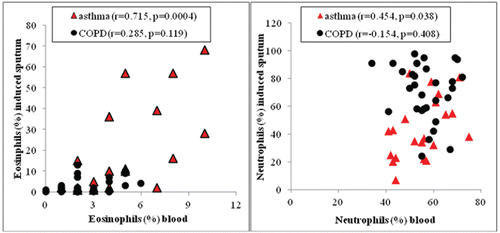
Figure 1. Correlations between blood and sputum eosinophils (red triangles) and blood and sputum neutrophils (black circles) in asthma and COPD patients.

Figure 2. Receiver operating characteristic (ROC) curve analysis of the diagnostic accuracy of different blood/serum (a) and induced sputum (b) biomarkers (IL-6, IL-17, IL-33, MMP-9, ECP, NE, eosinophil and neutrophil percentages and combined model) in the differentiation between asthma and COPD.
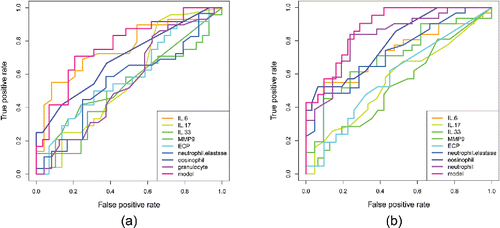
Figure 2. Receiver operating characteristic (ROC) curve analysis of the diagnostic accuracy of different blood/serum (a) and induced sputum (b) biomarkers (IL-6, IL-17, IL-33, MMP-9, ECP, NE, eosinophil and neutrophil percentages and combined model) in the differentiation between asthma and COPD.

Figure 3. Hierarchical clustering of asthma and COPD patients. Single set of clinical and laboratory data per one patient was used for clustering. (a) Patients clustered according to peripheral blood eosinophil percentage, FEV1%, FEV1/VC, RV%, pack-years, and atopy. (b) Patients clustered according to data from sputum samples (eosinophil and neutrophil percentages, IL-6, NE and MMP-9 concentrations) and clinical data (FEV1/VC, FEV1%, RV%, pack-years, and atopy status). Patient IDs are given at the bottom of the plot. The color scale codes the value of a variable with the brightest shade corresponding to the highest value.
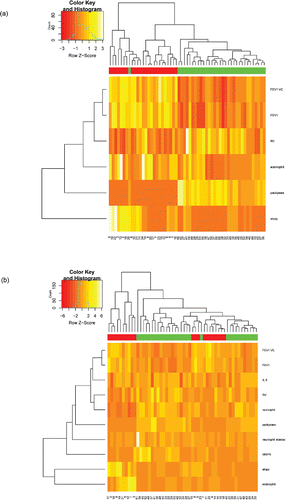
Figure 3. Hierarchical clustering of asthma and COPD patients. Single set of clinical and laboratory data per one patient was used for clustering. (a) Patients clustered according to peripheral blood eosinophil percentage, FEV1%, FEV1/VC, RV%, pack-years, and atopy. (b) Patients clustered according to data from sputum samples (eosinophil and neutrophil percentages, IL-6, NE and MMP-9 concentrations) and clinical data (FEV1/VC, FEV1%, RV%, pack-years, and atopy status). Patient IDs are given at the bottom of the plot. The color scale codes the value of a variable with the brightest shade corresponding to the highest value.

Reprints and Corporate Permissions

Please note: Selecting permissions does not provide access to the full text of the article, please see our help page How do I view content?

To request a reprint or corporate permissions for this article, please click on the relevant link below:

Academic Permissions

Please note: Selecting permissions does not provide access to the full text of the article, please see our help page How do I view content?

Obtain permissions instantly via Rightslink by clicking on the button below:

If you are unable to obtain permissions via Rightslink, please complete and submit this Permissions form. For more information, please visit our Permissions help page.