
Figures & data
Table 1. Measures used to evaluate baseline control as defined by Soler-Cataluña et al. (Citation10) and the database proxies used in the study.
Figure 1. Patient selection flow diagram showing identification of the study cohort following application of the study inclusion/exclusion criteria.
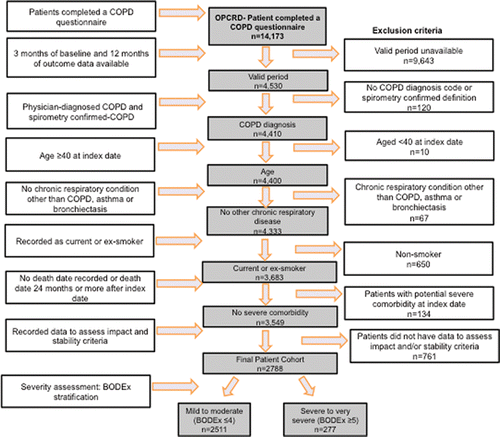
Figure 2. Evaluation of Control within the study population. (A) Flow diagram showing the number of patients within the mild/moderate COPD cohort with controlled/uncontrolled COPD, split by (i) Clinical-Feature-defined low impact (ii) CAT-defined low impact. (B) Flow diagram showing the number of patients within the severe/very severe COPD cohort with controlled/uncontrolled COPD, split by (i) Clinical-Feature-defined low impact (ii) CAT-defined low impact.
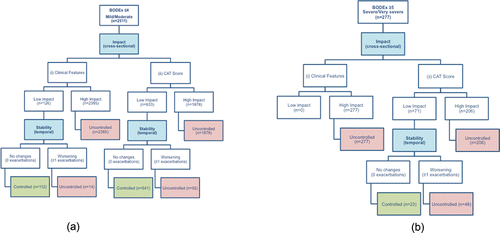
Table 2. Baseline demographics and clinical characteristics by COPD Control definition and resultant control status for patients with Mild/Moderate COPD, stratified by clinical features/CAT scores.
Table 3. Baseline demographics for patients with Severe/Very Severe COPD, stratified by clinical feature/CAT score assessment of COPD impact and resultant control status.
Table 4. Time to first exacerbation according to control status (by clinical symptom or CAT scores) in patients with different degrees of severity using two different BODEx thresholds (4 and 2 units).
Figure 3. Survival curves obtained from Cox regression analysis of the time to first COPD exacerbation over the year following COPD Control assessment, stratified by baseline control status.
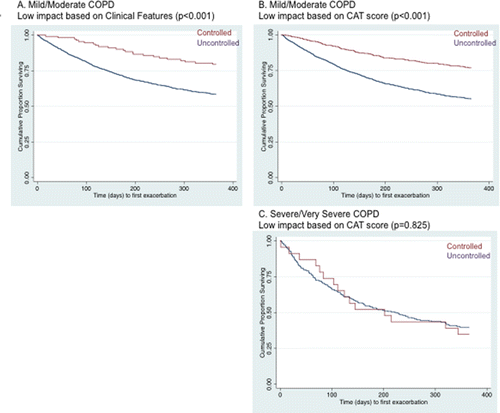
Table 5. Percentage of patients that failed to meet the threshold for control for each disaggregated component of low impact, split by COPD severity.