731
Views
7
CrossRef citations to date
0
Altmetric
Original Research

REM Sleep Imposes a Vascular Load in COPD Patients Independent of Sleep Apnea

, MD, , PhD, , MD ORCID Icon, , MD, , PhD, , MD, , MD, , MD & , MD show all
Pages 565-572 | Received 01 Dec 2016, Accepted 01 Aug 2017, Published online: 26 Sep 2017

Figures & data

Table 1. Anthropometric and clinical characteristics in patients with COPD (n = 27) and 2 non-COPD control groups (n = 115). Shown are means ± standard deviation.

Figure 1. Study flow chart. From a pool of polysomnographic sleep studies two analyses have been performed in the current study: Analysis 1 targteted overnight PPT in 142 patients divided in 3 subgroups; analysis 2 targeted sleep stage based PPT analysis performed in 12 COPD patients and 12 matched controls.
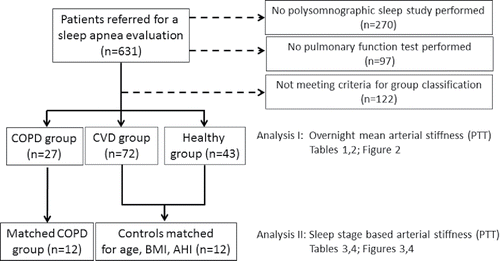
Figure 1. Study flow chart. From a pool of polysomnographic sleep studies two analyses have been performed in the current study: Analysis 1 targteted overnight PPT in 142 patients divided in 3 subgroups; analysis 2 targeted sleep stage based PPT analysis performed in 12 COPD patients and 12 matched controls.

Figure 2. Association between pulse propagation time (PPT in milliseconds) and time below 90% oxygen saturation (in minutes) for the three study groups: Healthy Controls group, Cardiovascular Disease group (CVD) and Chronic Obstructive Pulmonary Disease group (COPD). Spearmen rho correlation factor (R) and significance level are shown.
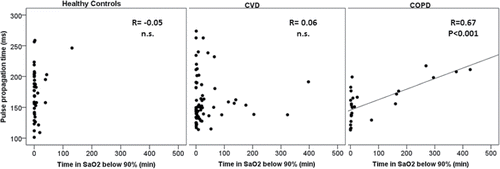
Figure 2. Association between pulse propagation time (PPT in milliseconds) and time below 90% oxygen saturation (in minutes) for the three study groups: Healthy Controls group, Cardiovascular Disease group (CVD) and Chronic Obstructive Pulmonary Disease group (COPD). Spearmen rho correlation factor (R) and significance level are shown.

Table 2. Independent predictors of mean overnight Pulse Propagation Time (PPT) obtained in 3 different General Linear Models for (a) 27 COPD patients, (b) 72 CVD patients and (c) 43 healthy controls. Beta values indicate the numerical influence on PPT for each factor listed in the table.

Table 3. Anthropometric and clinical data in patients with COPD and matched controls. Shown are means ± standard deviation.

Figure 3. Percentage of change in pulse propagation time (PPT, mean and standard error of the means (SEM)) from wakefulness (= 100%) in patients with COPD and matched non-COPD controls. Asterix indicate significant differences (all p < 0.05): Within group increase in PPT from wake to N3 (non-COPD controls) and PPT decrease from wake to REM (COPD patients); between group difference in REM sleep PPT between COPD patients and non-COPD controls. N1, N2, N3 and REM indicate the sleep stages NREM1-3 and REM. Please note, a decrease in PPT corresponds to an increase in arterial stiffness and vice versa.
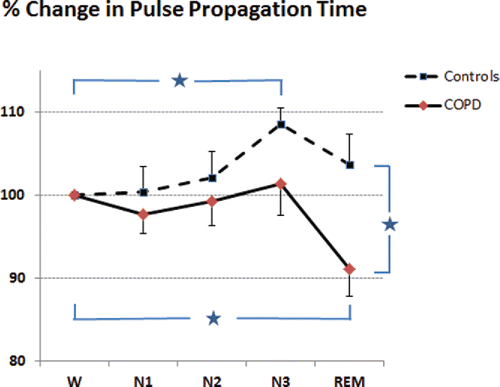
Figure 3. Percentage of change in pulse propagation time (PPT, mean and standard error of the means (SEM)) from wakefulness (= 100%) in patients with COPD and matched non-COPD controls. Asterix indicate significant differences (all p < 0.05): Within group increase in PPT from wake to N3 (non-COPD controls) and PPT decrease from wake to REM (COPD patients); between group difference in REM sleep PPT between COPD patients and non-COPD controls. N1, N2, N3 and REM indicate the sleep stages NREM1-3 and REM. Please note, a decrease in PPT corresponds to an increase in arterial stiffness and vice versa.

Table 4. Correlations between the change in pulse wave propagation time from wakefulness to REM-sleep and daytime hemodynamic parameters.

Figure 4. Association between the change in arterial stiffness (PPT) from wakefulness to REM sleep and daytime systolic blood pressure at rest in COPD patients and matched controls.

Figure 4. Association between the change in arterial stiffness (PPT) from wakefulness to REM sleep and daytime systolic blood pressure at rest in COPD patients and matched controls.
Supplemental material

E-supplement_L_Grote_Arterial_Stiffness_in_COPD_revision_3_clean_file.pdf

Download PDF (538.1 KB)

ICOP-1365119_E-supplement_L_Grote_Arterial_Stiffness_in_COPD_revision_3_red_marked.pdf

Download PDF (626.1 KB)

Reprints and Corporate Permissions

Please note: Selecting permissions does not provide access to the full text of the article, please see our help page How do I view content?

To request a reprint or corporate permissions for this article, please click on the relevant link below:

Academic Permissions

Please note: Selecting permissions does not provide access to the full text of the article, please see our help page How do I view content?

Obtain permissions instantly via Rightslink by clicking on the button below:

If you are unable to obtain permissions via Rightslink, please complete and submit this Permissions form. For more information, please visit our Permissions help page.