Figures & data
Figure 1. Map of pathologic slide preparation scheme. Centimeter scale as shown. T, tumour.
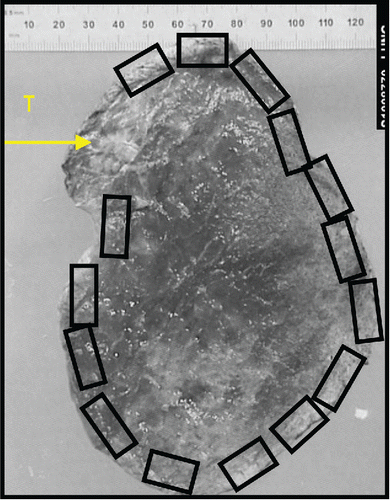
Figure 2. Illustrative examples of cancer lobectomy sections showing pre-specified histologic patterns as indicated, including various subtypes of fibrosis patterns. See also .
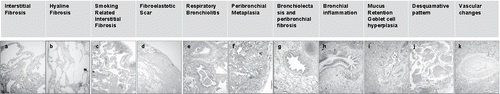
Table 1. Clinical data from prospective lung cancer lobectomy cohort.
Figure 3. Examples of radiologic–pathologic correlation in prospective lung cancer cohort subjects with heavy burden of SRIF. A. Right upper lobectomy of subject X with histological evidence of SRIF (insert shows normal lung away from SRIF and cancer). Scale as indicated. B. Corresponding magnified view of high resolution CT thorax of right upper lobe, showing centrilobular emphysema (arrows) and no visible interstitial lung abnormality. C. Right upper lobectomy sample of subject Y with histological evidence of SRIF (insert shows normal lung away from SRIF and cancer). Scale as indicated. D. Corresponding magnified view of high resolution CT thorax of right upper lobe, showing tumour, emphysema and no discernible interstitial lung abnormality.
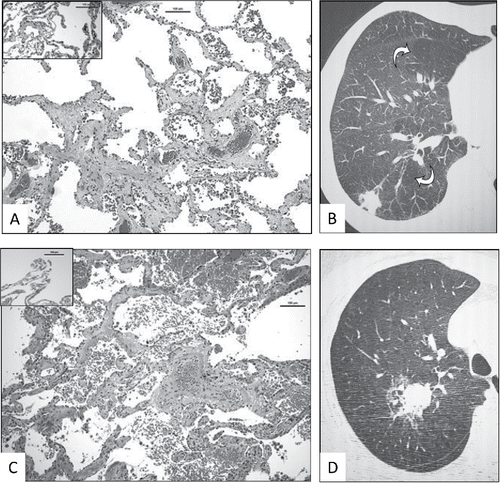
Table 2. Demographics of comparison cohorts.
Table 3. Histologic findings among the comparison cohorts.
Table 4. Relationship of respiratory bronchiolitis to SRIF as a function of background lung histology in the present authors’ cohorts.
Figure 4. In all SRIF subjects identified in the current authors’ cohorts, the proportion of cases with and without histologic evidence of respiratory bronchiolitis (RB) are shown, parsed by source tissue lung cancer status. The background histologies of the tissue sources are outlined in .
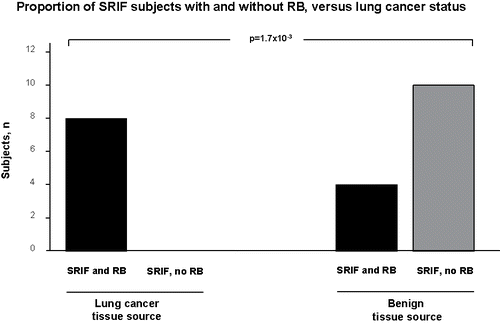
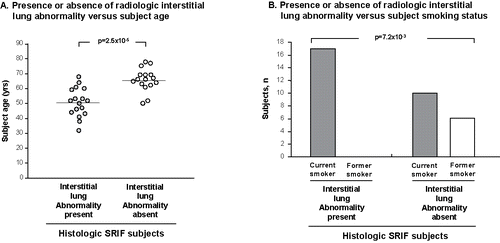
Figure 5. Analysis of pooled data of SRIF subjects (authors’ cohorts and other described cohorts in the published literature) with known status regarding radiologic interstitial lung abnormality (ILA), see text. A. Influence of subject age on radiologic ILA. Each dot represents an individual subject. Mean age represented by horizontal line. B. Histogram showing the effect of smoking status on radiologic ILA in the same SRIF subjects as in panel A.