Figures & data
Table 1. Evaluated questions (EQ3 to EQ9) of an electronic diary symptom questionnaire.
Table 2. Patients' demographics and baseline characteristics.
Table 3. Mean changes in symptoms on Days 7 and 14 in patients with and without a MCID in trough FEV1 (≥100 mL; responders and non-responders) at Week 12.
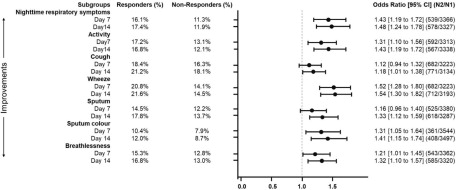
Figure 1. FEV1 responders at Week 12 as predicted by the improvement in individual symptoms on Days 7 and 14. The odds ratio and 95% confidence interval (CI) presented are adjusted for age, sex, baseline, baseline dyspnoea index and current smoking status. FEV1, forced expiratory volume in 1 second.
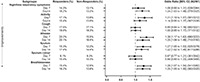
Table 4. Mean changes in symptoms on Days 7 and 14 in patients with and without a MCID in TDI total score (≥1 unit; responders and non-responders) at Week 12.
Figure 2. TDI responders at Week 12 as predicted by the improvement in individual symptoms on Days 7 and 14. The odds ratio and 95% confidence interval (CI) presented are adjusted for age, sex, baseline trough forced expiratory volume in 1 second (FEV1) and current smoking status. TDI, transition dyspnea index.