Figures & data
Table 1. St George's Respiratory Questionnaire activity and impact subscales differences between rank-ordered productive cough severity states in the Lovelace Smokers' Cohort (n = 1,422) and COPDGene Cohort (n = 4,488).
Table 2a. Baseline characteristics of productive cough severity states, determined by SGRQ activity and impact score, in the Lovelace Smokers Cohort, NM (n = 1422).
Table 2b. Baseline characteristics of productive cough severity states, determined by SGRQ total score, in the COPDGene cohort (n = 4488).
Table 3. Select predictors of higher productive cough severity states, using multivariable ordinal logistic regression for the Lovelace Smokers' Cohort (LSC) and the COPDGene Cohort.
Figure 1a. Transition probability matrix in the Lovelace Smokers Cohort – included in the longitudinal analysis was the ‘Cough only’ and ‘Fixed airflow obstruction only’ states which were not included in the cross-sectional analysis (n = 1,710). Multi-state Markov-like model analyzing longitudinal transition probabilities between productive cough disease severity states over approximately 5 years in the Lovelace Smokers' Cohort. The table is read vertically with the header representing the baseline state and each column in the vertical axis the transition probabilities to all possible states. Strength of transition probabilities is reflected by the percentage in each cell. Light grey cells denote the PC stage and white cells the non-PC stages. Dark grey cells following the diagonal axis of the table represent transition probabilities of staying within the same severity stage between study examination visits at 18-month intervals.
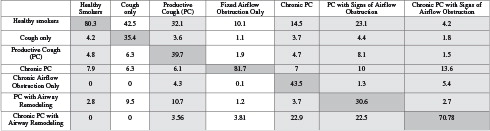
Figure 1b. Transition probabilities in the COPDGene Cohort – included in the longitudinal analysis were the ‘Cough only’ and ‘Fixed airflow obstruction only’ states which were not included in the cross-sectional analysis (n = 2,761). Multi-state Markov-like model analyzing longitudinal transition probabilities between productive cough disease severity states over approximately 5 years in the COPDGene cohort. The table is read vertically with the header representing the baseline state and each column in the vertical axis the transition probabilities to all possible states. Strength of transition probabilities is reflected by the percentage in each cell. Light grey cells denote the PC stage and white cells the non-PC stages. Dark grey cells following the diagonal axis of the table represent transition probabilities of staying within the same severity stage between study examination visits at 5-year intervals.
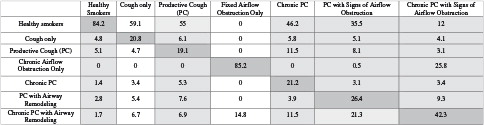
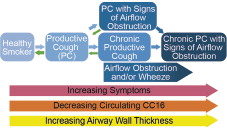
Figure 2. Schematic overview of PC by severity and the associated symptoms, circulating CC16 levels, and airway wall thickness. Note that transition to a healthier state drops once the most severe state is reached.