Figures & data
Table 1. General characteristics of the study population, including clinical, analytical and functional variables.
Figure 1. FeNO levels at different moments of determination.
*Differences with p < 0.001 between emergency room and stable phase.
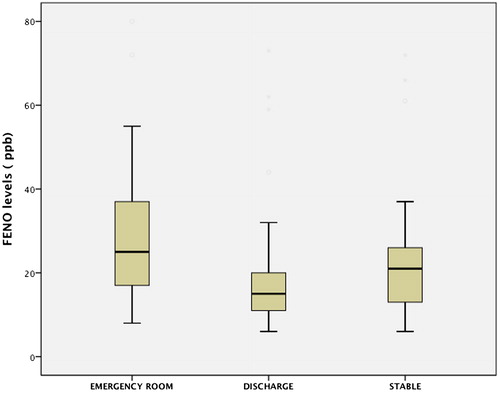
Figure 2. Correlation of FeNO levels with eosinophilia in peripheral blood in the emergency room (ER).
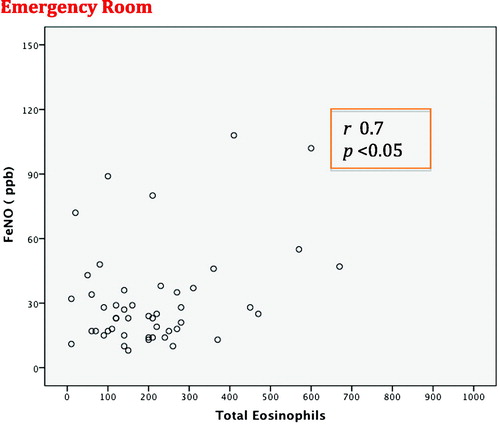
Figure 3. Correlation of FeNO levels with eosinophilia in peripheral blood at discharge (D).
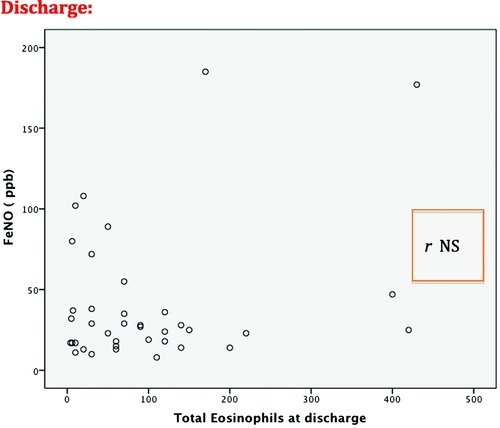
Figure 4. Distribution of FeNO levels according to clinical phenotypes (chronic bronchitis, emphysema, ACOS).
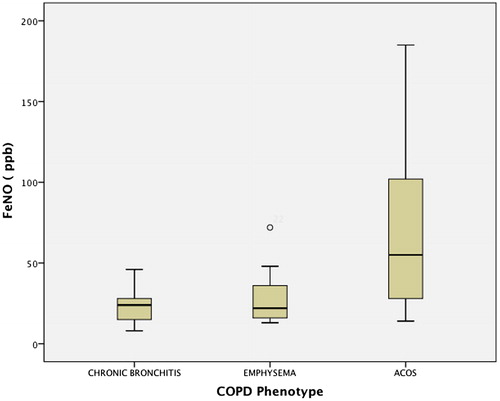
Table 2. FeNO levels, eosinophils and mean hospital stay of COPD exacerbations according to clinical phenotype.
Table 3. Values of the variables studied according to cut-off points of P50 (25 ppb) for FeNO and 2% eosinophils.
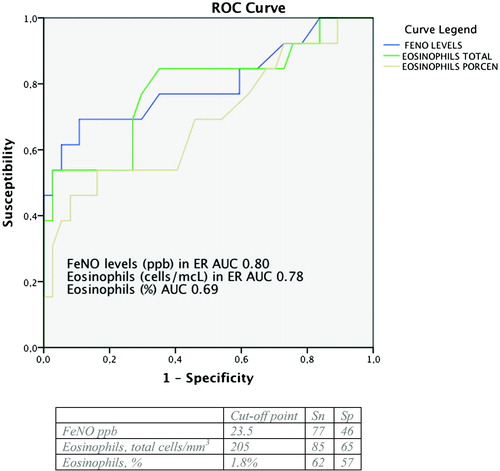
Figure 5. ROC curves: FeNO and eosinophil levels in the ER, at the start of the exacerbation, in correlation with the existence of the ACOS phenotype.