
Figures & data
Figure 1. Charlson Comorbidity Index score according to GOLD 2017 categories. The figure illustrates Box and Whiskers plots: the big square represents the median and small square represents mean ± standard deviation.
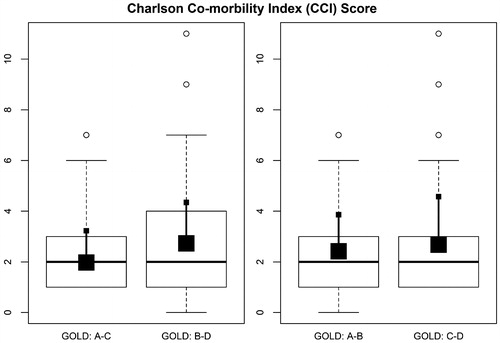
Table 1. Characteristics of the population with chronic obstructive pulmonary disease.
Table 2. Prevalence and crude/adjusted odds ratios for comorbidities in relation to GOLD 2017.
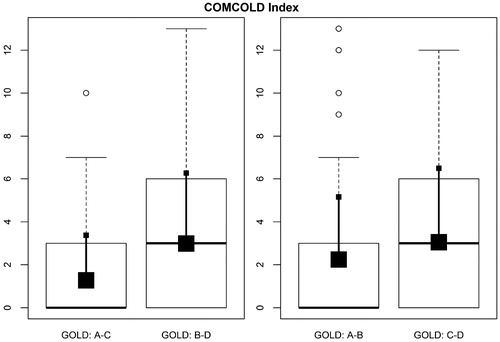
Figure 2. COMCOLD score according to GOLD 2017 categories. The figure illustrates Box and Whiskers plots: the big square represents the median and small square represents mean ± standard deviation.
Supplemental material