Figures & data
Figure 1. Panel A shows PRDS score distribution with respect to clinical evaluation at entry for each type of “setting” (LP, HP and VHP; for both LP vs. VHP and HP vs. VHP p < 0.0001); Panel B refers to BI distribution with respect to clinical evaluation at entry for each type of “setting” (LP, HP and VHP; for both LP vs. VHP and HP vs. VHP, p < 0.0001). Legend: The horizontal lines represent PRDS or BI decisional values. Box plots refer to median value and interquartile ranges. Circles indicate outliers.
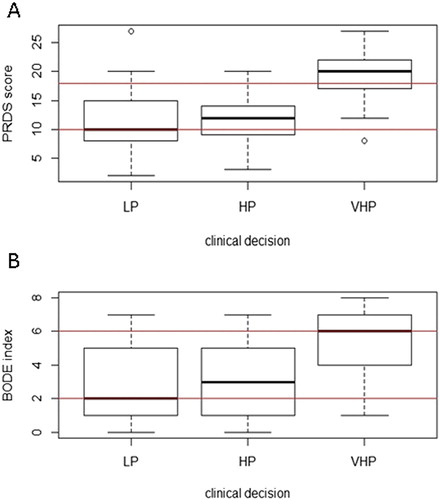
Table 1. Distribution of patient population according to PRDS, BI and Clinical decision (CD)
Table 2. Concordance between clinical decision, PRDS, BI in terms of Specificity (concordance in indicating LP, i.e. all real negative), Sensitivity (concordance in indicating HP or VHP, i.e. all real positive) and Efficiency (total concordance).
Table 3. Details for data which were differently evaluated by the tools: comparison of PRDS and BI with clinical decision and between PRDS and BI
Table 1 appendix: Efficiency, underprescription and overprescription of PRDS vs BI.
Figure 2. Correlation plot between PRDS score and BI. Patients graded for PR priority by Clinical Decision, are allocated in different sectors of the plot on the basis of PRDS and BODE PR priority. Legend: cases are represented as signs in a scatter plot. Different signs and colors have been used for the three groups of rehabilitation priority according to CD: group 1 (white circle) for LP; group 2 (grey triangle) for HP and group 3 (black circle) for VHP. The oblique black line is the Regression line PRDS score (y) versus BI (x). Horizontal blue lines identify PRDS score limits (continue for LP-HP and dashed for HP-VHP). Vertical blue lines identify BI limits (continue for LP-HP and dashed for HP-VHP). The four blue lines split the plot into nine different sectors indicating PR priority by PRDS and BI: A. Discordance VHP PRDS-LP BI; B. Discordance HP PRDS-LP BI; C. Concordance LP; D. Discordance VHP PRDS-HP BI; E. Concordance HP; F. Discordance LP PRDS-HP BI; G. Concordance VHP; H. Discordance HP PRDS-VHP BI; I. Discordance LP PRDS-VHP BI.
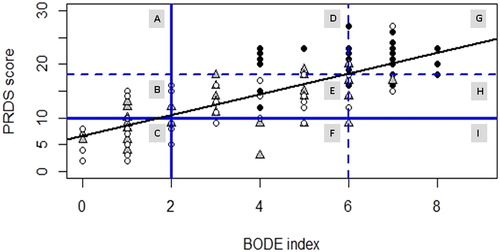
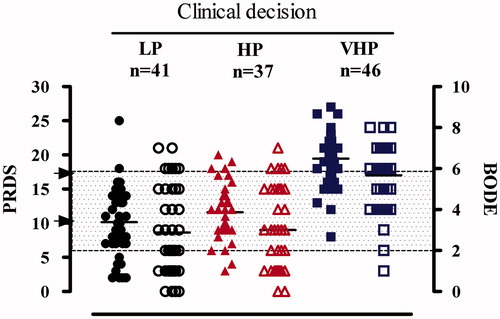
Figure 1 appendix shows clinical evaluation at entry for each type of “setting” (LP, HP and VHP) and the corresponding PRDS score and BI. Single dots represent cases (filled shapes for PRDS and empty form for BI) and black lines represent the median values within the group. Grey box defines areas for BI score: ≤2 white; 2–6 dots; ≥6 white; black arrows indicate cut off (for PRDS scores).