Figures & data
Figure 1. Study flow chart
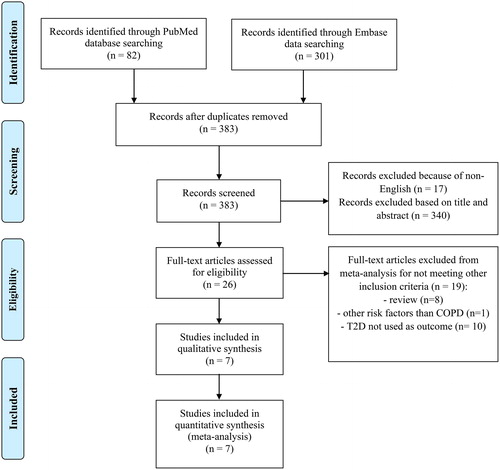
Table 1. Full eligibility criteria used in the search strategy.
Table 2. Characteristics of the studies included in the meta-analysis.
Figure 2. Forest-plot showing the association between COPD and T2D. Generic inverse variance outcome analysis with random effect on outcome of all included studies with adjusted data.
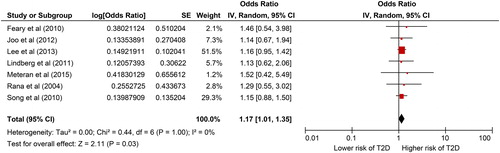
Figure 3. Funnel plot of standard error by log odds ratio of all included studies in the meta-analysis.
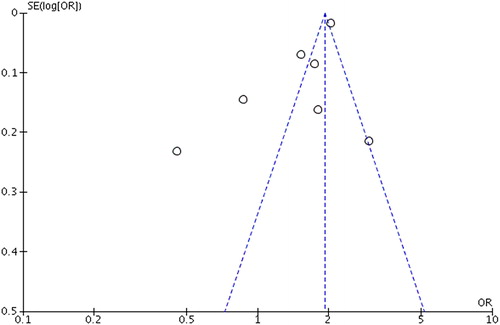
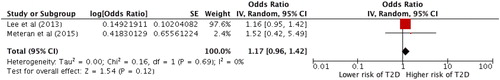
Figure 4. Forest plot showing the association between COPD and T2D. Generic inverse variance outcome analysis with random effect on the outcome of subgroup analysis comparing studies using COPD diagnosis according to guidelines versus studies with COPD diagnosis based on questionnaire.
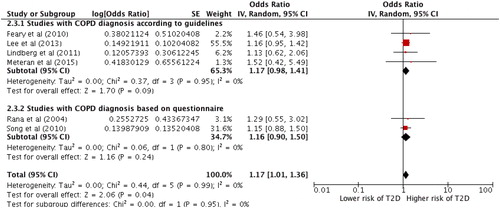
Figure 5. Forest plot showing the association between COPD and T2D. Generic inverse variance outcome analysis on studies using diagnostic methods according to guidelines for both COPD and T2D.