
Figures & data
Figure 1. Flowchart showing the study profile in patients with acute exacerbation of chronic obstructive pulmonary disease (AECOPD). EBC: exhaled breath condensate.
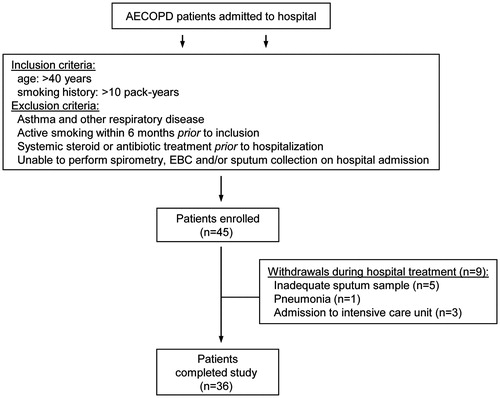
Table 1. Demographic and clinical characteristics of study subjects.
Figure 2. Superoxide dismutase (SOD) (a) and catalase (CAT) (b) activities in sputum supernatant of healthy controls (controls), stable COPD patients (stable), and AECOPD patients at the time of acute exacerbation (ex) and after hospital treatment (treat). Horizontal bars represent median values. *p < 0.05 and **p < 0.01 vs. stable COPD patients, §p < 0.001 vs. healthy controls, #p < 0.05 and ##p < 0.005 vs. acute exacerbation.
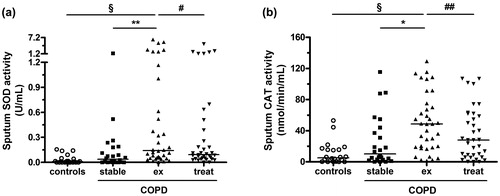
Table 2. Superoxide dismutase (SOD) and catalase (CAT) activities in sputum and serum of healthy controls, stable COPD patients, and AECOPD patients at the time of acute exacerbation and after hospital treatment.
Table 3. Correlations between sputum superoxide dismutase (SOD)/catalase (CAT) activities and clinical variables, sputum inflammatory cells, and sputum MDA levels in stable COPD patients and in those with AECOPD.