Figures & data
Table 1. Anchor and distribution-based methods to estimate the minimal important and detectable differences.
Table 2. Sample characterisation.
Table 3. Mean scores at the onset of AECOPD (T1), after 45 days of AECOPD (T4) and mean change for the respiratory measurement by the COPD Assessment Score.
Figure 1. Correlations between changes in the CAT and changes in the (A) modified Borg scale, (b) modified British Medical Research Council questionnaire (mMRC) and (C) forced expiratory volume in one second (FEV1).
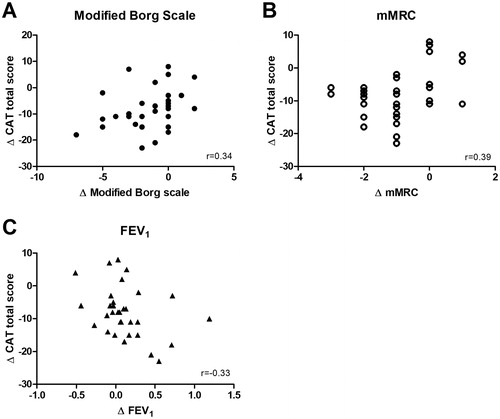
Figure 2. ROCs to discriminate between patients improving above and below the MID in CAT (i.e. two points) for the modified British Medical Research Council questionnaire (mMRC).
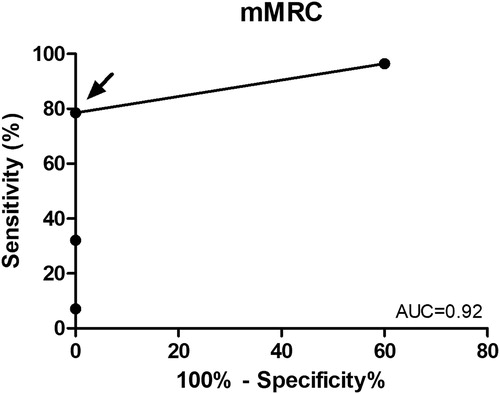
Figure 3. Linear regression between the CAT and the (A) modified Borg scale, (b) modified British Medical Research Council questionnaire (mMRC) and (C) FEV1.
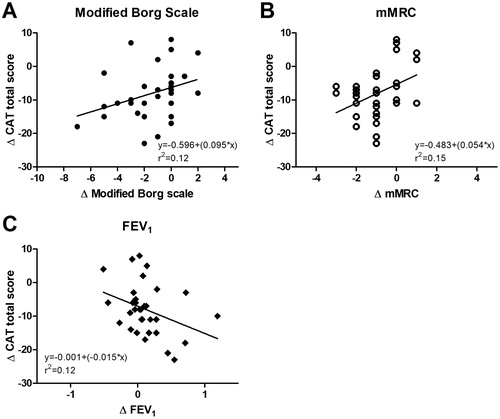
Table 4. Anchor-based and distribution-based estimates of the minimal important and detectable differences of the respiratory measures.
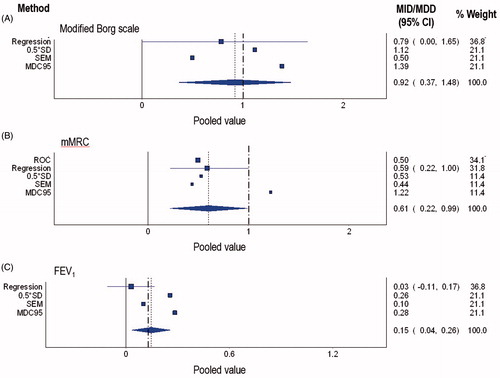
Figure 4. Summary plots of the pooled values of the MID and MDD for the (A) modified Borg scale; (B) modified British Medical Research Council (mMRC) questionnaire and (C) forced expiratory volume in one second (FEV1), percentage predicted. The horizontal plots represent the minimal clinically important difference estimates derived in this study, classified per method. Where appropriate the estimates include the 95% confidence interval. The bold dotted vertical line resembles the MID estimate as obtained from the literature for stable patients with COPD.