Figures & data
Table 1: Sociodemographic characteristics stratified by site.
Figure 1. Sex-, site- and category-stratified prevelances of Body Mass Index (BMI). The prevalence of BMI was stratified by sex (women on the left, men on the right) and WHO classification for underweight, normal, overweight, and obese individuals (BMI between 0–18.5, 18.5–25, 25–30, and over 30 kg/m2, respectively) across the 13 LMIC sites. Sites were ordered according to the overall prevalence of Obesity in Men from highest (top) to lowest (bottom).
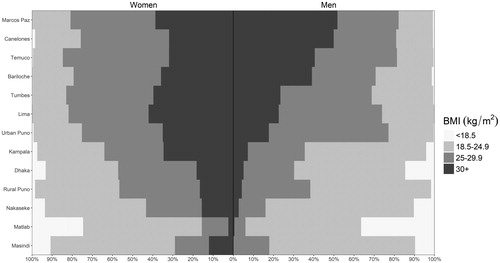
Figure 2. Body mass index vs. the probability of having COPD in our sample. We plotted probabilities from a multivariable adjusted model (solid line), single-variable non-adjusted model (broken line), and binned probabilities with corresponding 95% confidence intervals. The multivariable model was adjusted for age, sex, daily cigarette smoking, level of education completed, and post-treatment pulmonary tuberculosis.
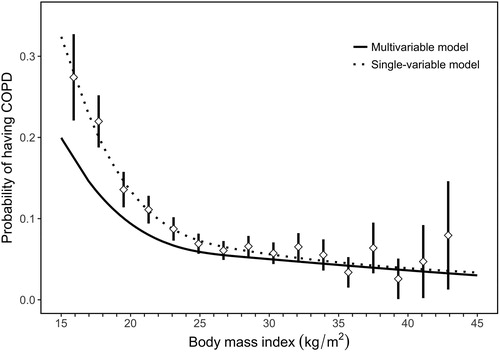
Figure 3. Associations between low body mass index (BMI < 19.8 kg/m2) and COPD outcomes obtained from multivariable regression models, and interaction effects with sex, smoking status, biomass use, age, and educational attainment. Panel A shows estimates using data from all sites, while panel B shows site-specific estimates. In panel A, odds ratios and the corresponding 95% confidence intervals are represented by diamonds and lines, respectively. We also tabulated numerical values for the odds ratios and the corresponding 95% confidence intervals. In panel B, site-specific odds ratios are presented by triangles. In the overall model, we evaluated the association between having a BMI < 19.8 kg/m2 and COPD prevalence adjusted for age, sex, biomass use, daily cigarette smoking, previous pulmonary tuberculosis, and secondary education. We then assessed for interaction effects between having a BMI < 19.8 kg/m2 and either sex, smoking status, biomass use, age, or educational attainment on COPD outcomes. Models stratified by sex were adjusted for age, daily cigarette smoking, biomass, previous pulmonary tuberculosis, and secondary education. Models stratified by smoking status were adjusted for age, sex, biomass, previous pulmonary tuberculosis, and secondary education. Models stratified by biomass use were adjusted for sex, daily cigarette smoking, previous pulmonary tuberculosis, and secondary education. Models stratified by age were adjusted for sex, daily cigarette smoking, biomass, previous pulmonary tuberculosis, and secondary education. Models stratified by educational attainment were adjusted for age, sex, daily cigarette smoking, biomass, and previous pulmonary tuberculosis. Models with severity and symptom status of COPD as outcomes were adjusted for age, sex, daily cigarette smoking, biomass, previous pulmonary tuberculosis, and secondary education.
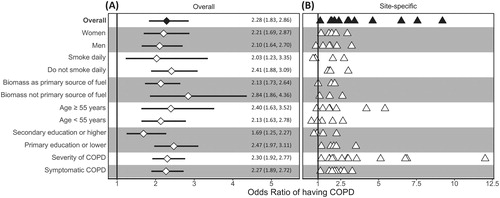
Figure 4. Body mass index vs. pre-bronchodilator FEV1/FVC z-scores. Crude lung function values were plotted behind boxplots. Each boxplot encompasses values within one-unit of BMI (i.e., 1 kg/m2). We included a broken red line at a pre-bronchodilator FEV1/FVC z-score of −1.64 to help visualize which values are below the lower limit of normal (bottom 5th percentile).
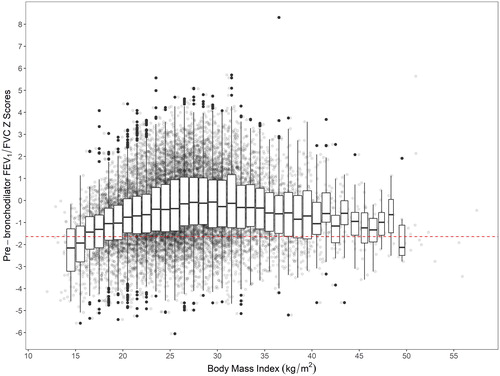
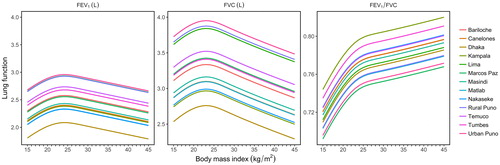
Figure 5. Body mass index vs. fitted values for FEV1, FVC, and FEV1/FVC, stratified by site. All models were adjusted for age, sex, daily cigarette smoking, level of education completed, and previous pulmonary tuberculosis. We used linear mixed-effects models with random intercepts by site.