
Figures & data
Table 1. Pooled demographics and baseline characteristics from the FLIGHT1 and FLIGHT2 studies by bronchodilator reversibility (FAS).
Figure 1. LSM change from baseline in (A) FEV1 AUC0–12h and (B) trough FEV1 at Week 12 by bronchodilator reversibility (FAS). ***p < 0.001 versus placebo; †††p < 0.001 versus non-reversible. AUC: area under the curve; FAS: full analysis set; FEV1: forced expiratory volume in 1 second; IND/GLY: indacaterol/glycopyrrolate 27.5/15.6 µg; LSM: least squares mean; SE: standard error.
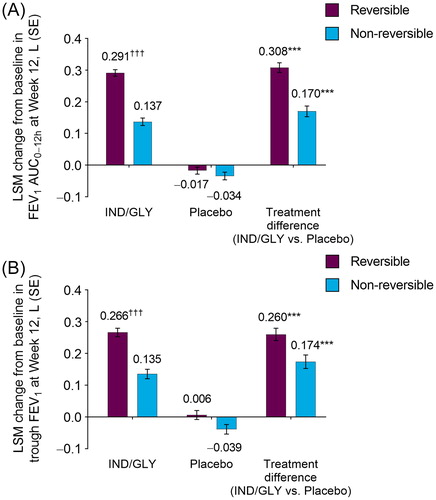
Figure 2. LSM change from baseline in (A) SGRQ total score, (B) CAT total score, and (C) TDI focal score at Week 12 by bronchodilator reversibility (FAS). *p < 0.05, **p < 0.01, ***p < 0.001 versus placebo. CAT: COPD (chronic obstructive pulmonary disease) Assessment Test; FAS: full analysis set; IND/GLY: indacaterol/glycopyrrolate 27.5/15.6 µg; LSM: least squares mean; SE: standard error; SGRQ: St George’s Respiratory Questionnaire; TDI: transition dyspnoea index.
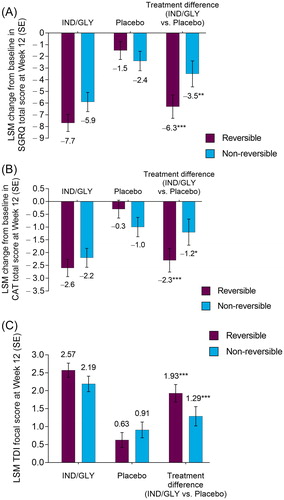
Figure 3. LSM change from baseline in (A) mean number of puffs of rescue medication per day and (B) mean daily total symptom score over 12 weeks by bronchodilator reversibility (FAS). ***p < 0.001 versus placebo. †p < 0.05 versus non-reversible. FAS: full analysis set; IND/GLY: indacaterol/glycopyrrolate 27.5/15.6 µg; LSM: least squares mean; SE: standard error.
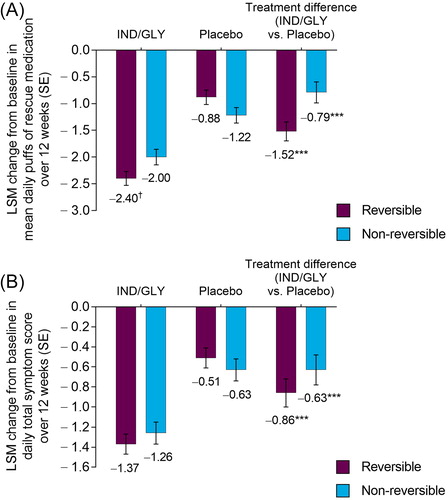
Table 2. Incidence of AEs, serious AEs, and the most common AEsTable Footnotea from the FLIGHT1 and FLIGHT2 studies by bronchodilator reversibility (safety population).
Data sharing statement
Sunovion Pharmaceuticals Inc. is part of a clinical trial data sharing consortium that facilitates access for qualified researchers to selected anonymized clinical trial data. For up-to-date information on data availability please visit https://www.clinicalstudydatarequest.com/Study-Sponsors.aspx and click on ‘Sunovion’.