
Figures & data
Table 1. General characteristics of study participants at each site and overall.
Figure 1. Flow chart of data extraction.
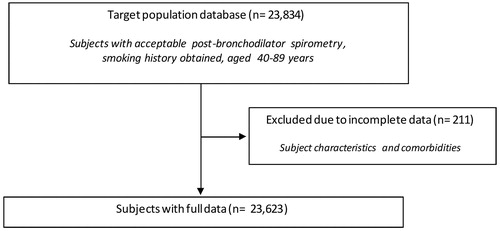
Figure 2. Meta-analysis of the adjusted odds ratios for CVD in subjects with airflow obstruction. Forest plot showing the meta-analysis of odds ratios for CVD, adjusting for age, smoking (pack-years and current smoking status), BMI, education and sex in subjects with airflow obstruction compared to those without airflow obstruction. Heterogeneity chi-squared = 27.68, d.f. = 26 (P = 0.374). I-squared (variation in ES attributable to heterogeneity) = 6.1%. Estimate of between-study variance Tau-squared = 0.0095. Test for overall effect: Z = 0.00 (P = 0.999). The following sites could not be included in the analysis due to a low number of subjects reporting CVD or singularity in the data: Blantyre (Malawi), Ife (Nigeria), Mumbai (India), Penang (Malaysia), Pune (India), Srinagar (India).
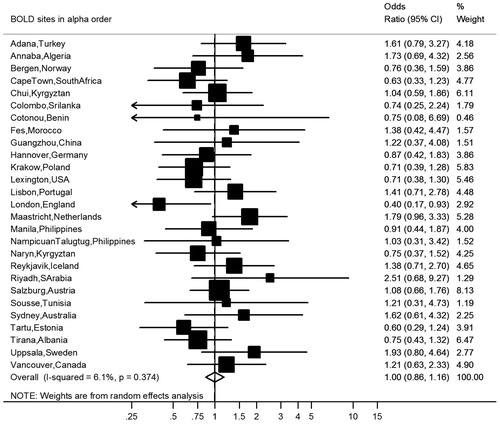
Figure 3. Meta-analysis of the adjusted odds ratios for hypertension in subjects with airflow obstruction. Forest plot showing the meta-analysis of odds ratios for hypertension, adjusting for age, smoking (pack-years and current smoking status), BMI, education and sex in subjects with airflow obstruction compared to those without airflow obstruction. Heterogeneity chi-squared = 65.31, d.f. = 31 (P = 0.000). I-squared (variation in ES attributable to heterogeneity) = 52.5%. Estimate of between-study variance Tau-squared = 0.0694. Test for overall effect: Z = 1.79 (P = 0.074). The following sites could not be included in the analysis due to a low number of subjects reporting hypertension: Ife (Nigeria).
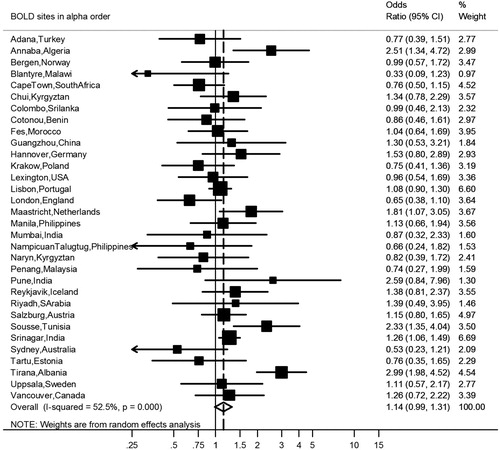
Figure 4. Meta-analysis of the adjusted odds ratios for diabetes in subjects with airflow obstruction. Forest plot showing the meta-analysis of odds ratios for diabetes, adjusting for age, smoking (pack-years and current smoking status), BMI, education and sex in subjects with airflow obstruction compared to those without airflow obstruction. Heterogeneity chi-squared = 24.24, d.f. = 24 (P = 0.448). I-squared (variation in ES attributable to heterogeneity) = 1.0%. Estimate of between-study variance Tau-squared = 0.0017. Test for overall effect: Z = 3.35 (P = 0.001). The following sites could not be included in the analysis due to a low number of subjects reporting diabetes or singularity in the data: Cotonou (Benin), Guangzhou (China), Ife (Nigeria), NampicuanTalugtug (Philippines), Naryn (Kyrgyztan), Pune(India), Srinagar (India), Uppsala (Sweden).
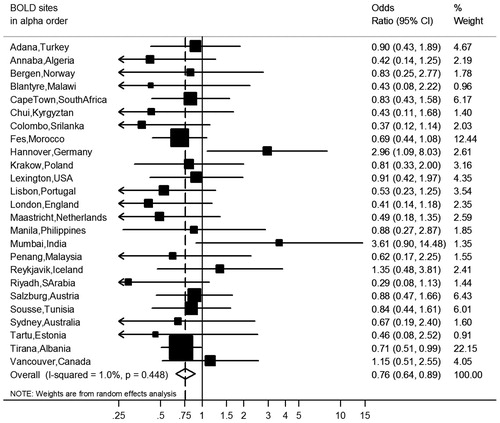
Figure 5. Meta-analyses of the odds ratios for comorbidities in subjects with airflow obstruction, showing the influence of the threshold to define airflow obstruction and adjusting for covariates. Summary forest plots showing the unadjusted, partly adjusted, and completely adjusted odds ratios (meta-OR) and the 95% CI for A. diabetes, B. hypertension, and C. CVD in subjects with airflow obstruction compared to those without airflow obstruction (left column: FEV1/FVC < 2.5th percentile, middle column: FEV1/FVC < 5th percentile, right column: FEV1/FVC < 0.70). Adjusting for all variables at the same time (as shown bottom of each panel), leaving out one variable for each model (middle of each panel), and running one model without any adjusting variables (as shown in the upper part of each panel). The variables age, smoking (pack-years and current smoking status), BMI, education and sex were analyzed. Details of these meta-analyses are reported in Supplementary Table 4.
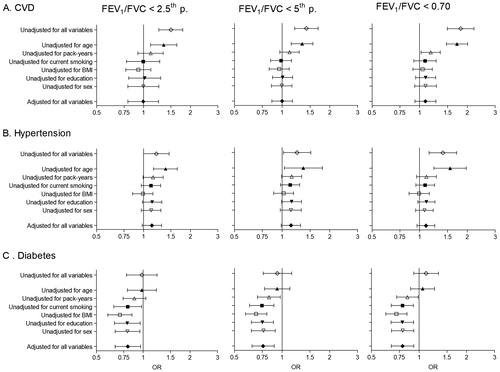
Table 2. Association of airflow obstruction with comorbidities stratified by sex, smoking history and gross national income.